1. Test Background - Verifying ADCP Performance and Consistency
To verify the measurement performance and consistency of China Sonar Acoustic Doppler Current Profiler (ADCP) , a two-day bottom-mounted test was carried out in the sea area of Dinghai District, Zhoushan City, Zhejiang Province. During the test, two PandaADCP-DR-300K-1000m devices were simultaneously installed on the same seabed machine and placed on the seabed at a depth of 50 to 60 meters. By collecting and analyzing the measurement data of flow velocity and direction in this sea area, the aim is to evaluate the measurement accuracy and consistency performance of the acoustic doppler profiler in the actual marine environment. The focus of this test is to ver-ify that the flow measurement results of the ADCP are consistent with the actual marine environment and that the measurement results of the two devices are consistent, so as to ensure that the measurement results of the ADCP doppler are accurate and reliable.
2. Test Introduction - ADCP Deployment and Test Process
On September 3, 2024, a seabed machine equipped with two PandaADCP 300kHz was deployed in Dinghai District, Zhoushan City, Zhejiang Province (122°06'58.16393"E, 29°56'50.41142"N), with a water depth of 60 meters. At 15:30, the two devices began to measure alternately. The measurement ended at 15:30 on September 5, 2024. The ADCP profiler was recovered at 17:00. The two PandaADCP 300K are set with a layer thickness of 2 meters, 40 measurement layers, 20 effective layers (beyond the water surface range after layer 21), and 1152 effective measurement frames.
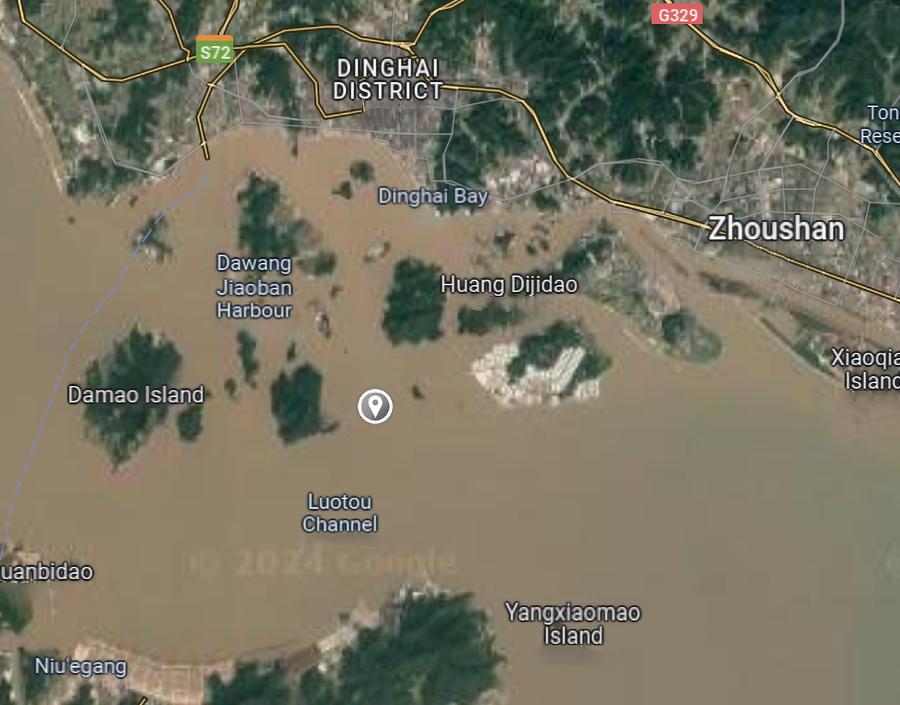
Figure 2.1 Deployment sea area
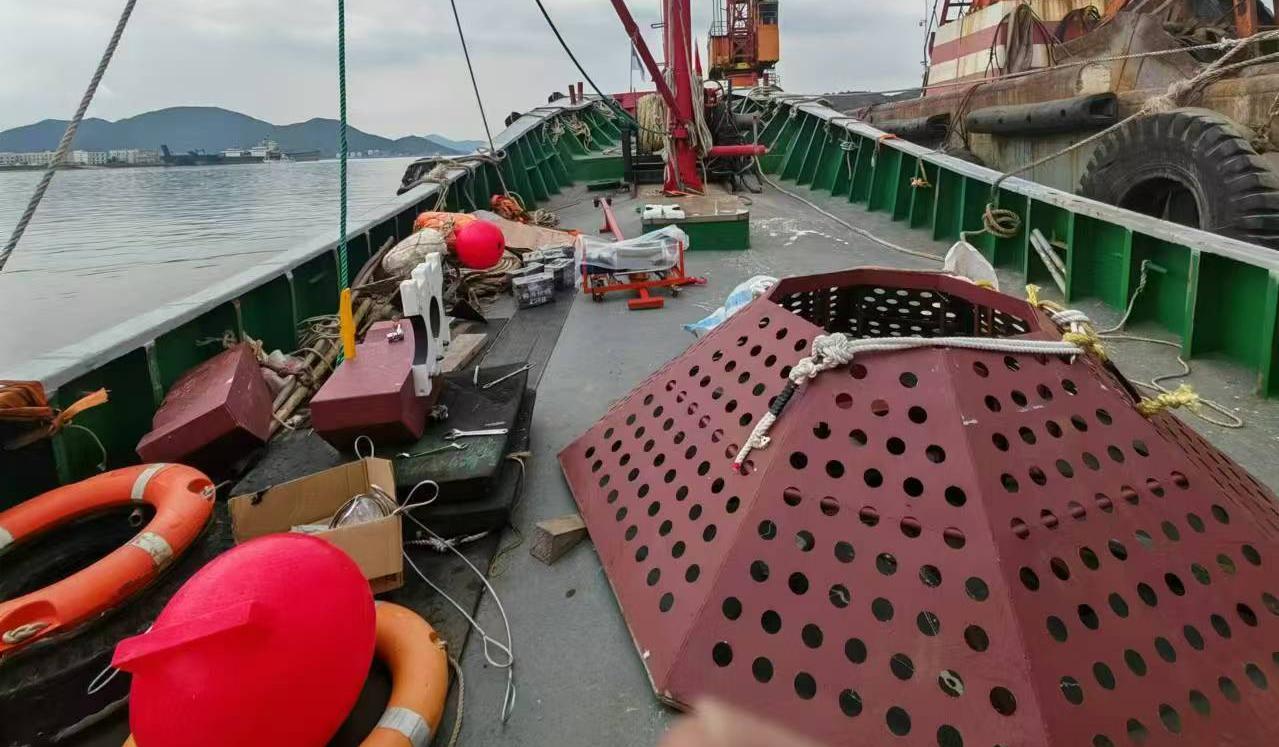
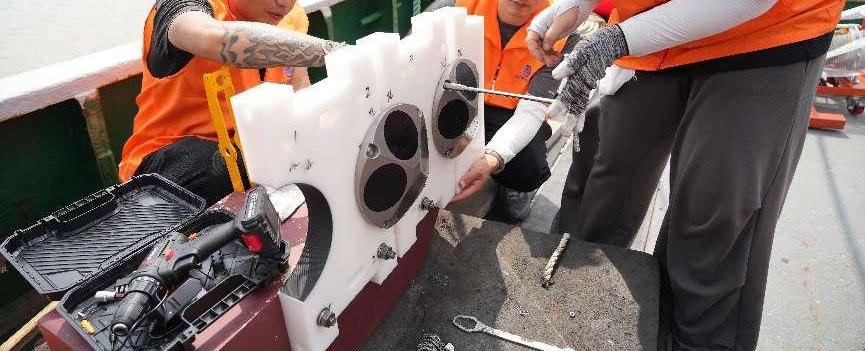
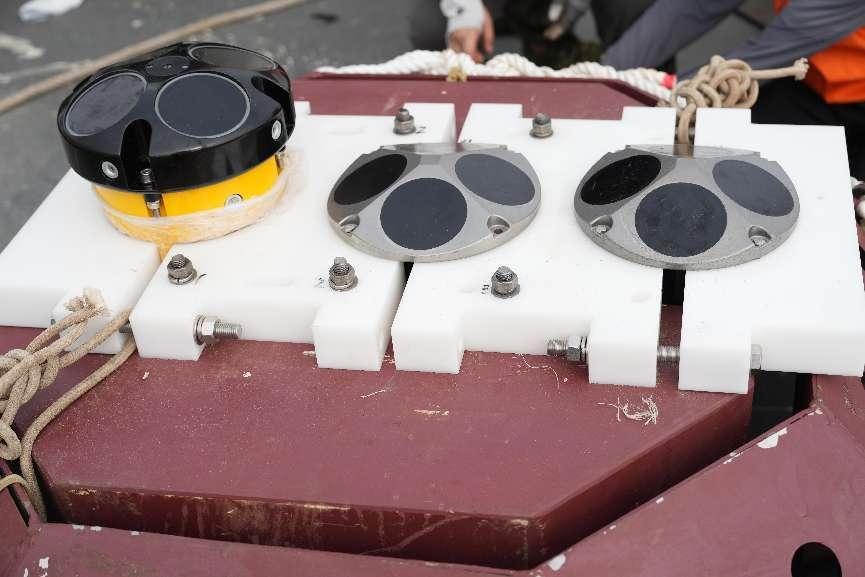
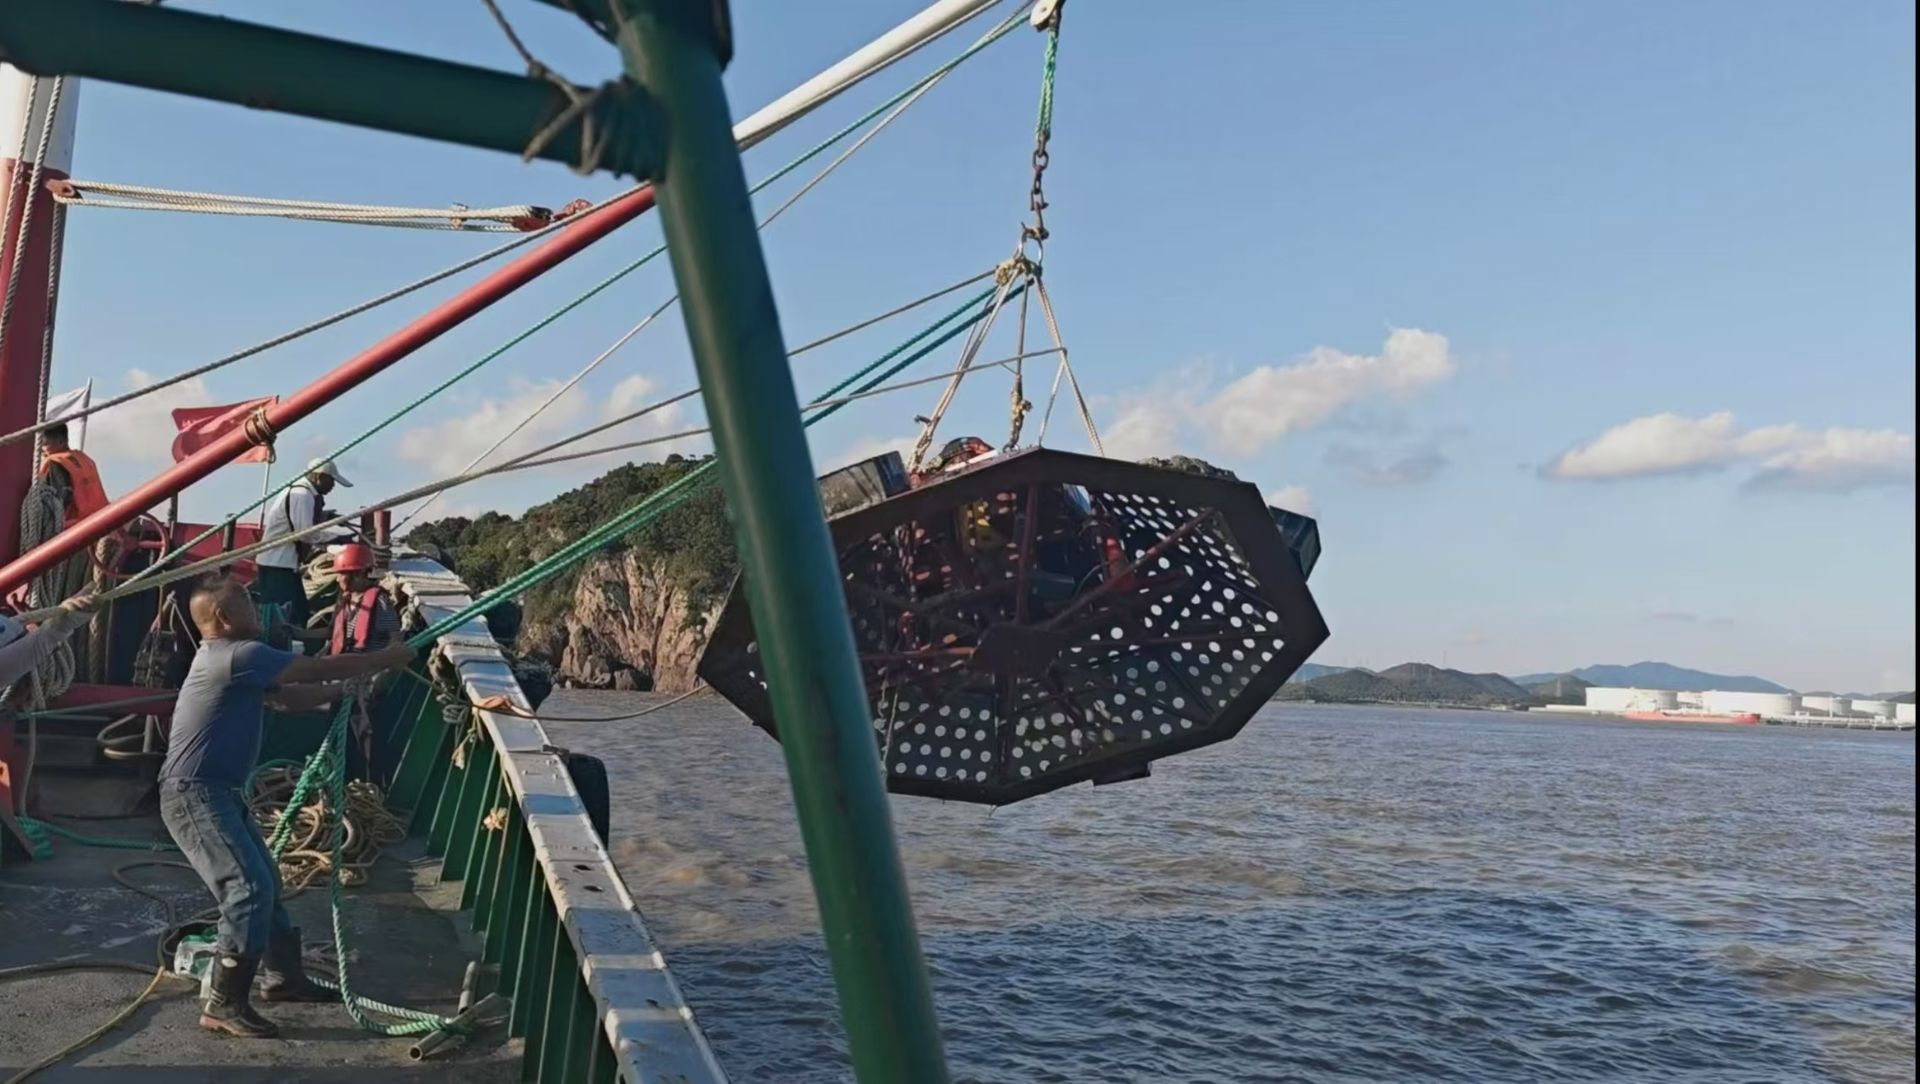
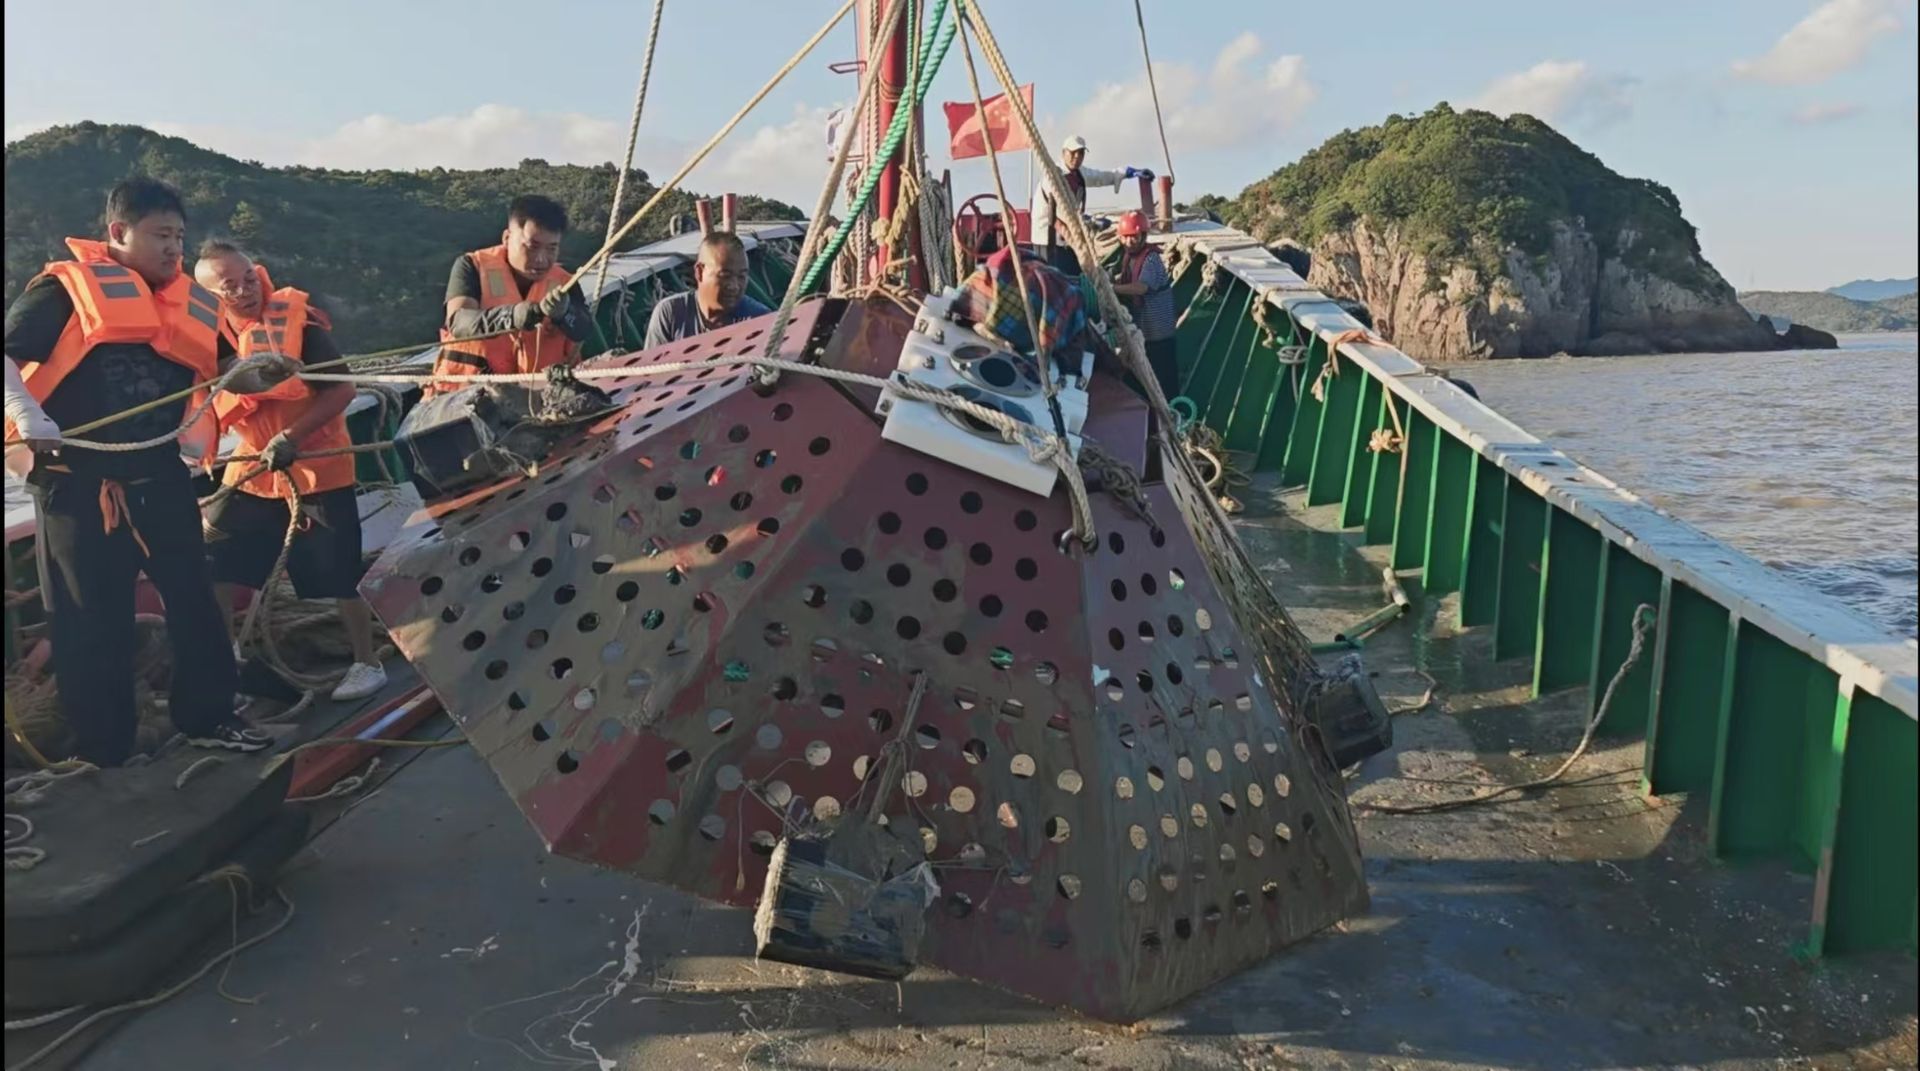
Figure 2.2 ADCP deployment and recovery site
3. Data Analysis
Data analysis includes two major parts: accuracy analysis and consistency analysis. Accuracy analysis: aims to evaluate whether the parameters such as flow velocity and direction measured by adcp profiler are consistent with the actual environmental conditions. By comparing the data of adcp doppler with the field measured values or known reference data, the reliability and accuracy of its measurement results are determined. Consistency analysis: used to compare the measurement results of two or more devices and evaluate whether their data under the same conditions are consistent. By comparing the output data of different devices, it is judged whether their performances under the same measurement environment are consistent, so as to ensure the reliability of the data. Through these two types of analysis, the accuracy of acoustic doppler current profiler adcp measurement data and the consistency between devices can be comprehensively evaluated to ensure the scientific nature and credibility of the measurement results.
3.1 Accuracy Analysis - Comparison with the Actual Environment
Accuracy Analysis Dinghai District, Zhoushan City, Zhejiang Province is located along the coast of the East China Sea and close to the East China Sea of China. It belongs to a typical marine climate area. Under the influence of tides and ocean currents, the flow velocity and direction of ocean currents have obvious periodic and seasonal changes. The test sea area is mainly affected by semidiurnal tides, that is, there are two high tides and two low tides every day. The flow velocity and direction of tidal currents change greatly during high tide and low tide. During high tide, the ocean current flows from the southeast to the northwest and the water level rises. During low tide, the ocean current flows from the northwest to the southeast and the water level drops. The speed of tidal currents usually decreases to the minimum value when the tide changes (from high tide to low tide and from low tide to high tide), and reaches the maximum flow velocity when the tidal current accelerates. Figure 3.1 shows the tidal situation in the test sea area released by the meteorological department during the test.

Figure 3.1 Tidal actual situation in the test sea area during the test period.
The acoustic doppler profiler data output protocol is the standard PD0 protocol, which is fully compatible with Teledyne RDI ADCP. Figures 3.2 to 3.5 are analyzed by WinADCP software and are the measurement results of flow velocity, flow direction, echo intensity and correlation coefficient respectively. As can be seen from the figures, the changes in measured water surface height, flow velocity and flow direction are consistent with the tidal changes in Figure 3.1. In the high tide stage, the water level rises (reflected by echo intensity), and the flow is from southeast to northwest. In the low tide stage, the water level drops, and the flow is from northwest to southeast. Figure 3.6 is a synchronous display after normalizing the flow velocity and flow direction. As can be seen from the figure, the flow velocity decreases to the minimum value when the tide changes (from high tide to low tide and from low tide to high tide), which is consistent with the actual situation. Figures 3.7 and 3.8 are comparisons of the flow velocity and flow direction results of 20 layers within the effective measurement range. As can be seen from the figures, the measurement results of flow velocity and flow direction at different depths have high consistency.
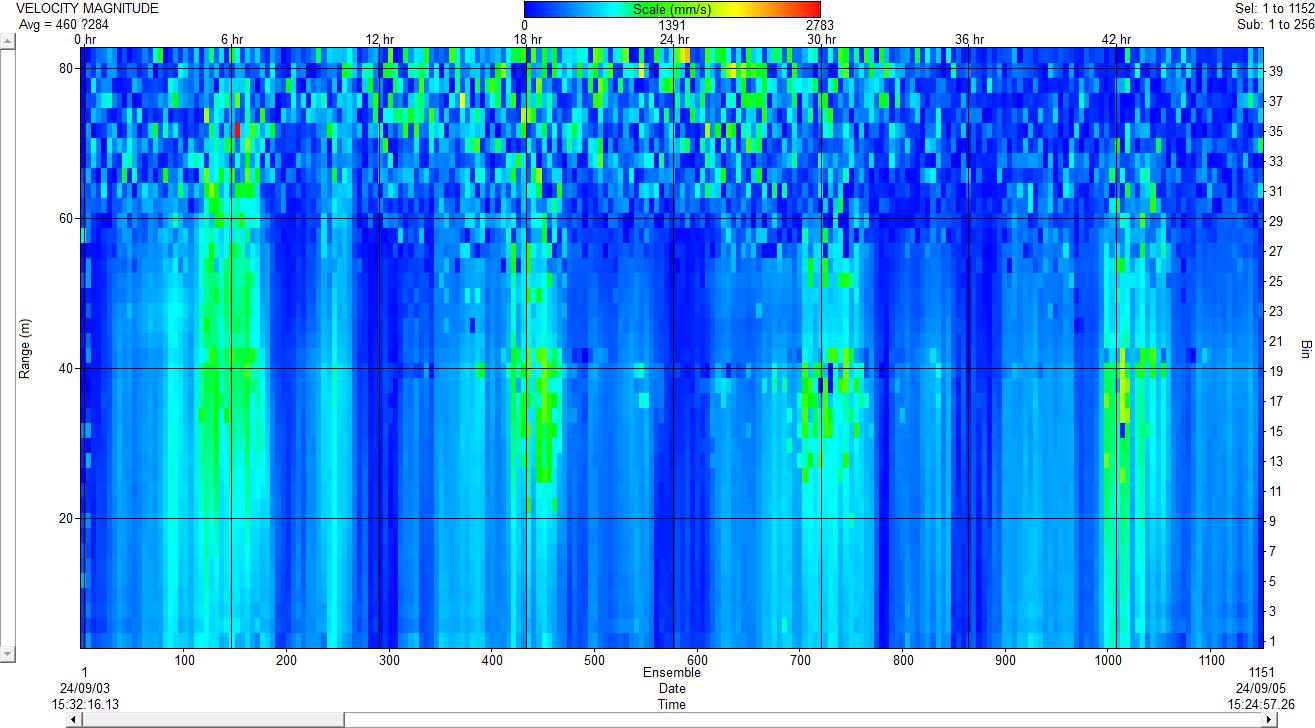
Figure 3.2 Flow velocity measurement result
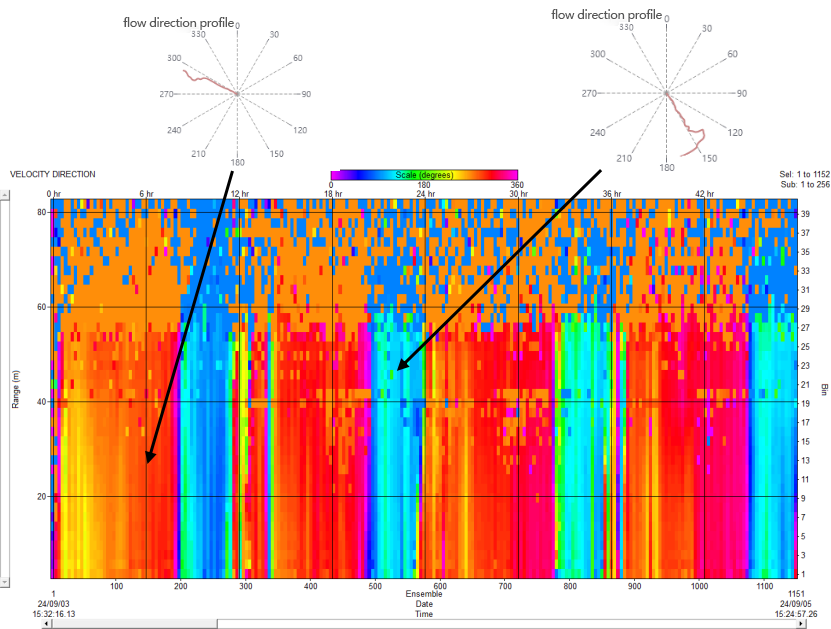
Figure 3.3 Flow direction measurement result.
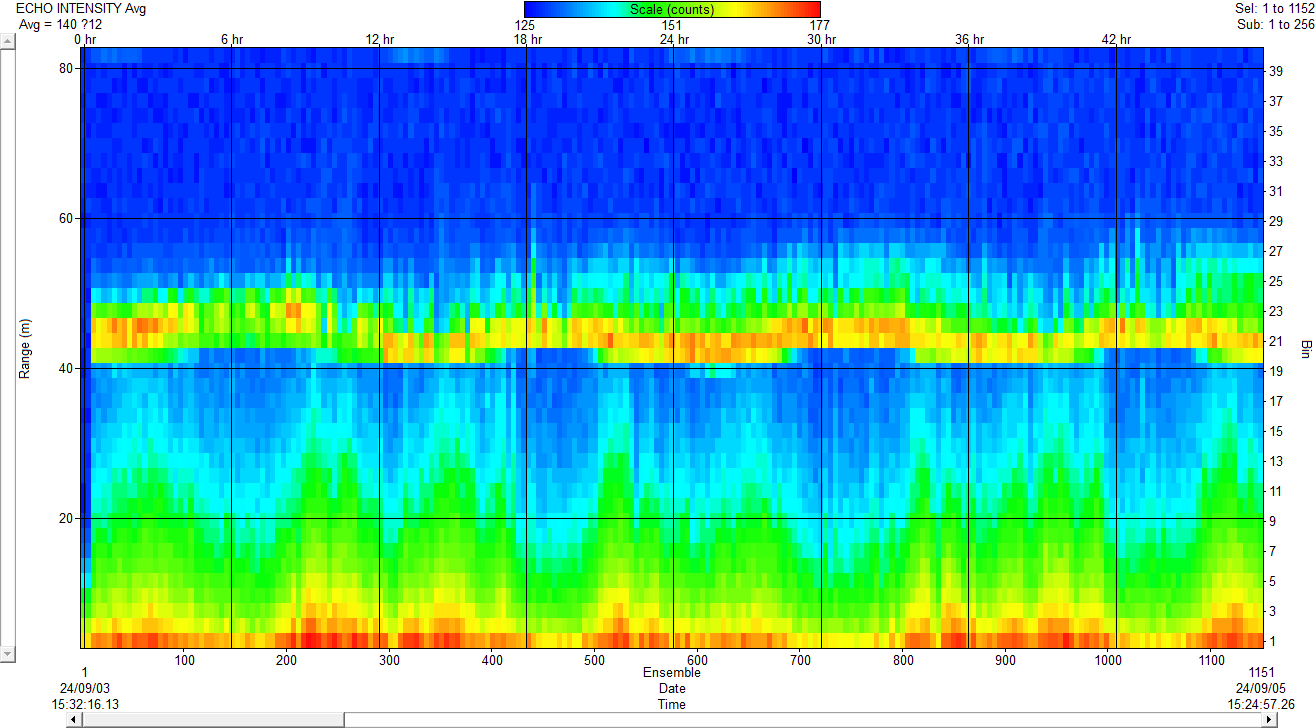
Figure 3.4 Echo intensity measurement result.
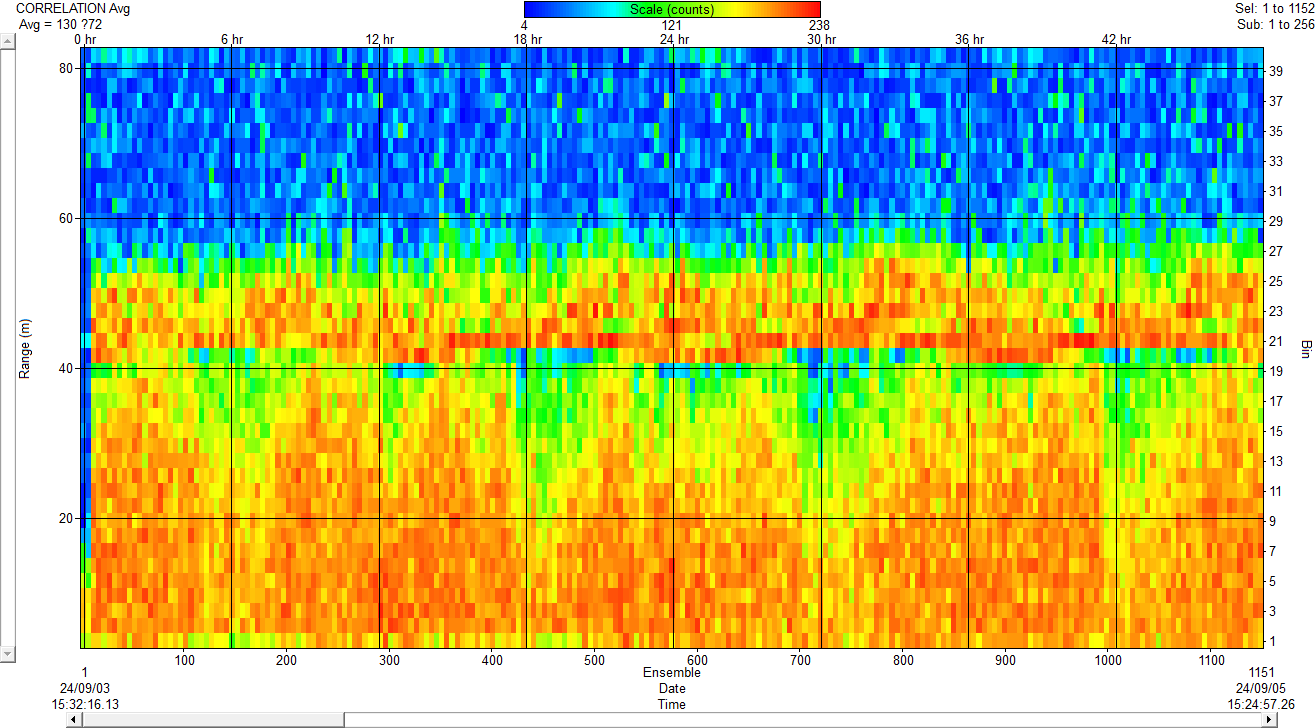
Figure 3.5 Echo correlation measurement result.
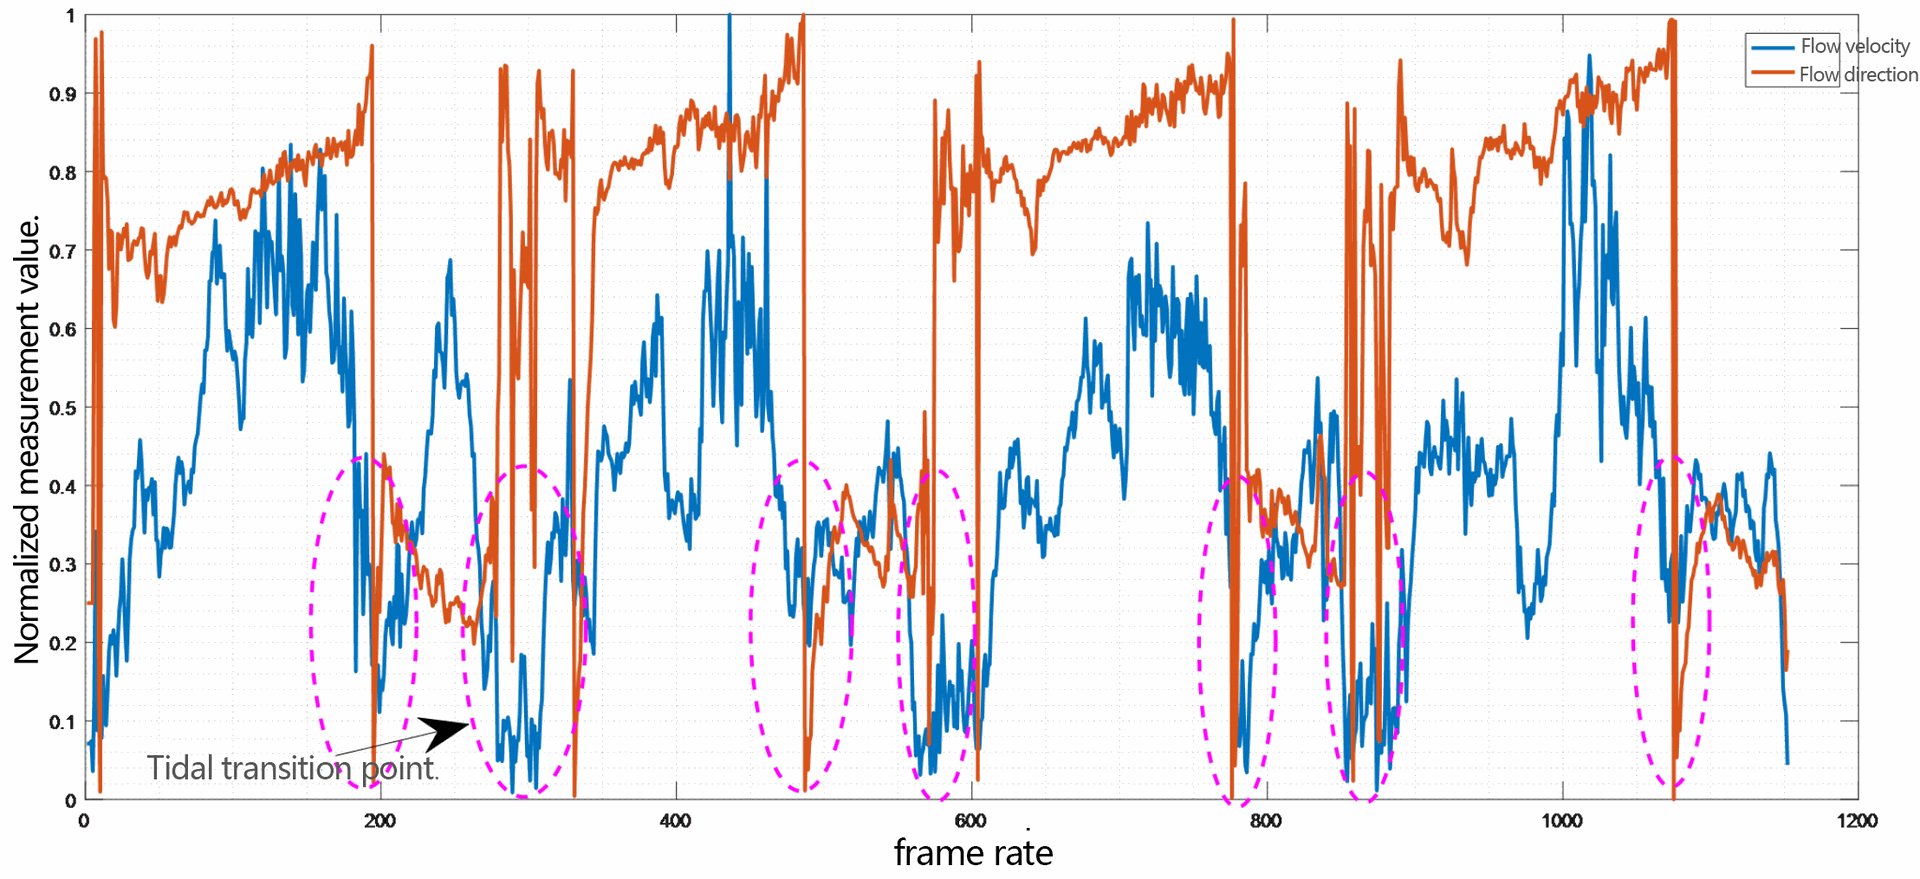
Figure 3.6 Relationship between flow velocity, flow direction and tide.
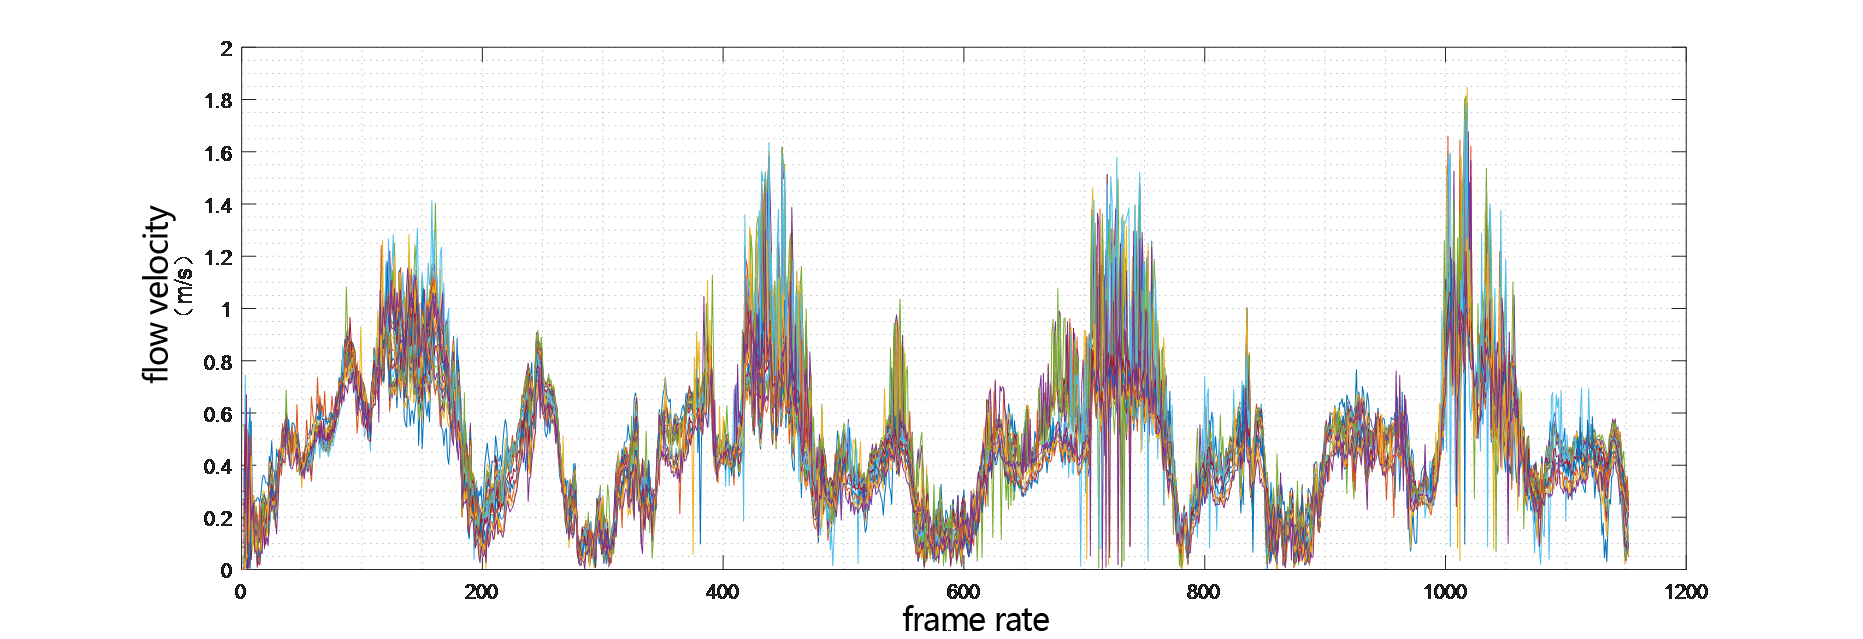
Figure 3.7 Flow velocity measurement results at different depth layers.
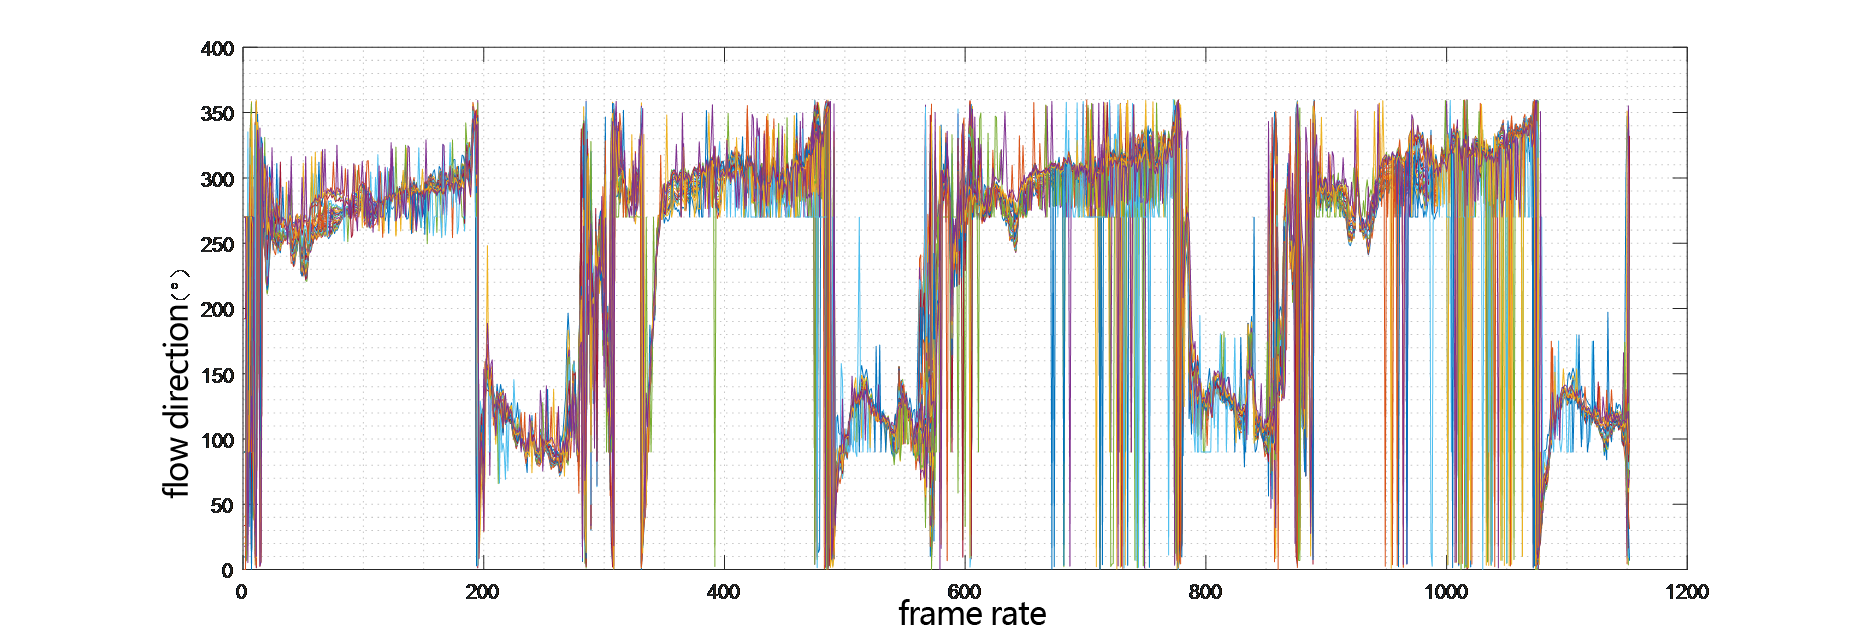
Figure 3.8 Flow direction measurement results at different depth layers.
In conclusion, the measurement results of ocean currents by China-sonar's PandaADCP 300kHz are consistent with the actual situation. It can correctly measure the variation laws of ocean current information such as flow velocity and flow direction with time and depth.
3.2 Consistency Analysis - Comparison between Two Devices
By comparing and analyzing the flow velocity and flow direction data measured by two adcp meter at each depth layer, the measurement consistency of the two devices is verified. Figures 3.9 and 3.10 respectively show the comparison results of the flow velocity and flow direction of two adcp flow meter at each depth layer changing with time. As can be observed from the figures, the measurement results of the two devices maintain a high degree of consistency during the measurement period, indicating that the performance of the two acoustic doppler profiler is basically the same under the same measurement conditions.
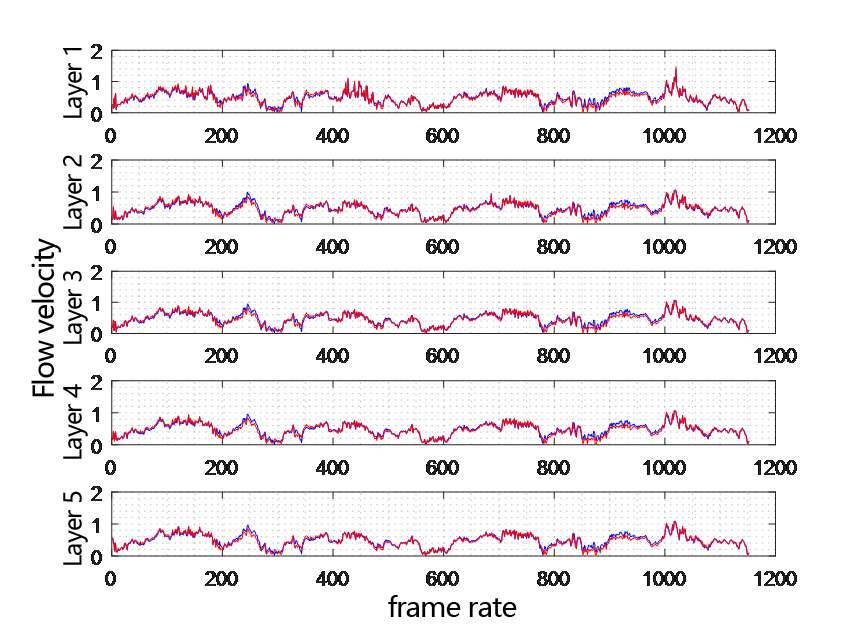
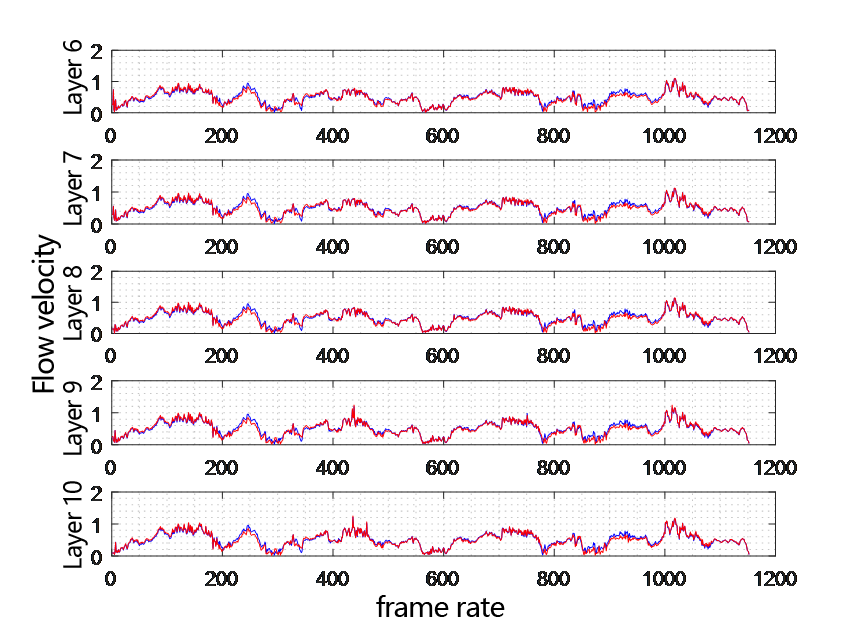
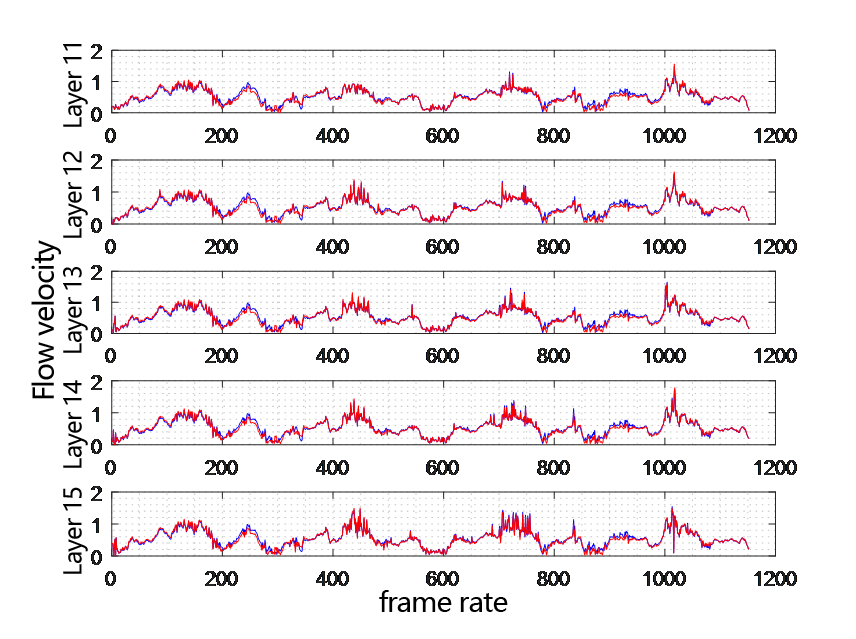
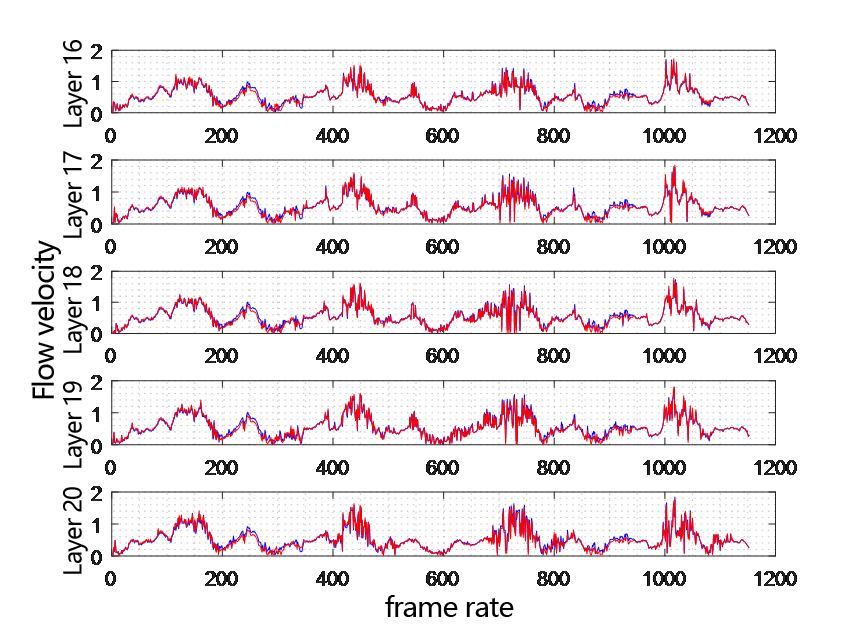
Figure 3.9 Comparison chart of flow velocity at each depth layer of two ADCP changing with time.
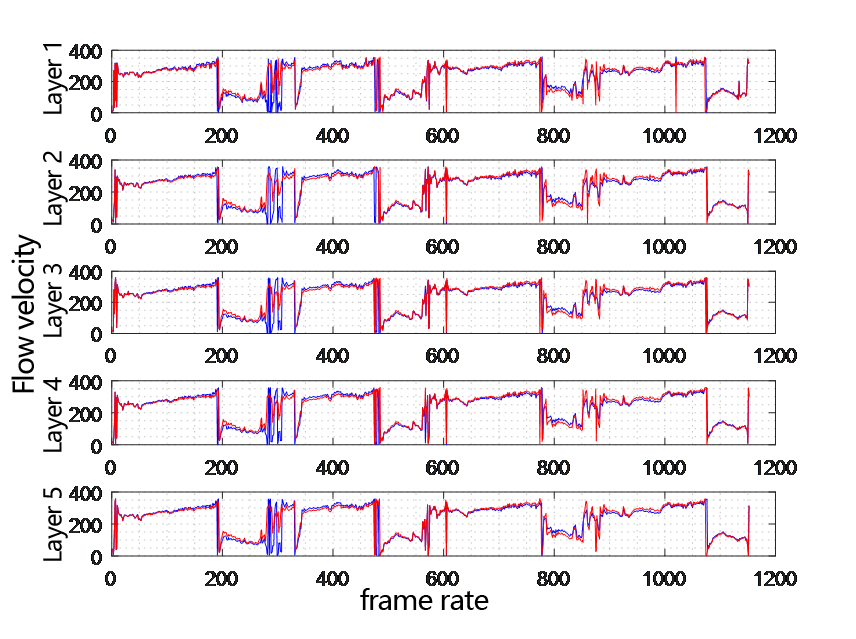
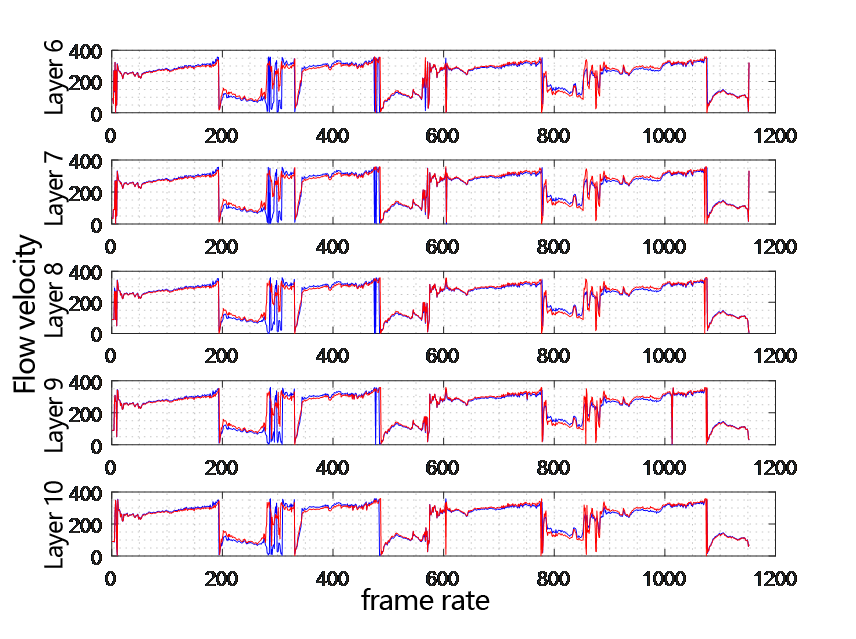
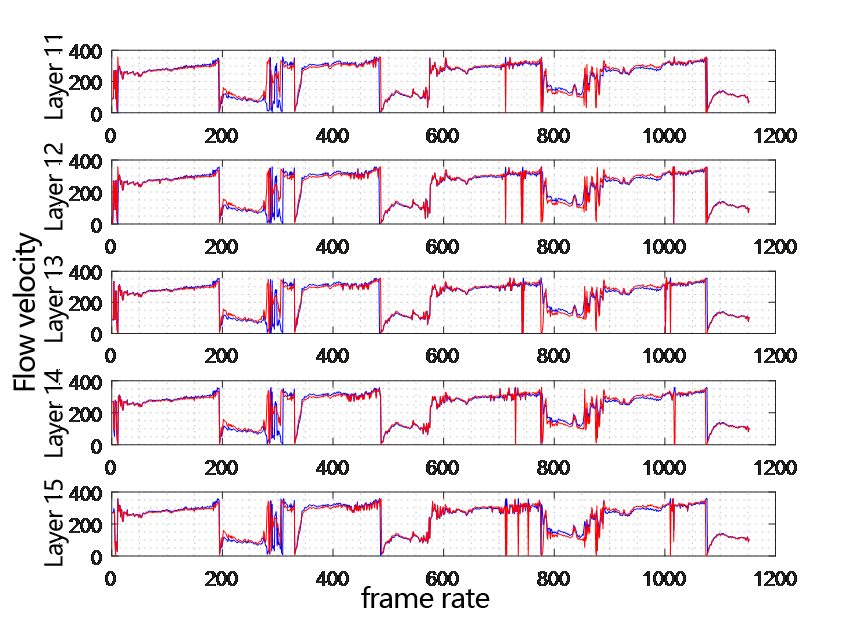
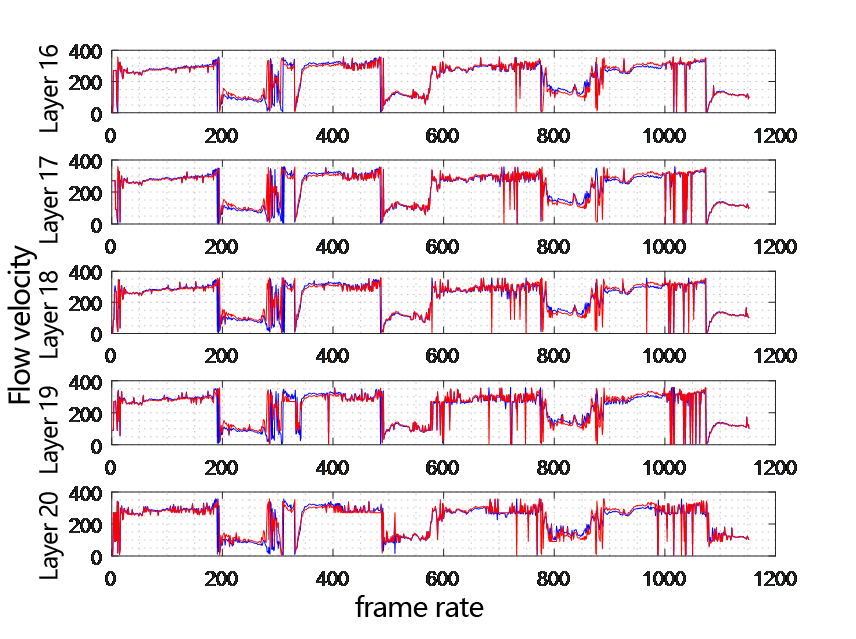
Figure 3.10 Comparison chart of flow direction at each depth layer of two ADCP changing with time.
By analyzing the flow velocity error and flow velocity correlation coefficient at each depth layer, a quantitative evaluation of the flow velocity measurement consistency of the two devices is carried out. Based on tidal changes, the flow velocity consistency in the high tide and low tide stages is compared and analyzed respectively to more carefully evaluate the measurement consistency of the two devices under different tidal conditions. The analysis results from Tables 3.1 and 3.2 show that the two devices have good consistency in the high tide and low tide stages.
Table 3.1 Consistency analysis results in the high tide stage.
Seq. No. of layer
|
Water layer depth (m)
|
Mean 1 (m/s)
| Mean 2 (m/s)
|
Error value (m/s)
|
Correlation coefficient
|
1 | 43-45 | 0.61361 | 0.5796 | 0.034012 | 0.99275 |
2 | 41-43 | 0.59656 | 0.56442 | 0.032143 | 0.99881 |
3 | 39-41 | 0.60662 | 0.57447 | 0.032149 | 0.9948 |
4 | 37-39 | 0.60994 | 0.57802 | 0.031913 | 0.99754 |
5 | 35-37 | 0.62039 | 0.58842 | 0.031969 | 0.99692 |
6 | 33-35 | 0.62948 | 0.5976 | 0.031888 | 0.99744 |
7 | 31-33 | 0.64079 | 0.60876 | 0.032025 | 0.99669 |
8 | 29-31 | 0.65222 | 0.62019 | 0.032031 | 0.99675 |
9 | 27-29 | 0.66254 | 0.63052 | 0.032019 | 0.99636 |
10 | 25-27 | 0.67153 | 0.63952 | 0.032019 | 0.99601 |
11 | 23-25 | 0.68045 | 0.64865 | 0.031807 | 0.9961 |
12 | 21-23 | 0.68972 | 0.65775 | 0.031975 | 0.99506 |
13 | 19-21 | 0.69364 | 0.6618 | 0.031839 | 0.99526 |
14 | 17-19 | 0.69813 | 0.66664 | 0.031491 | 0.99492 |
15 | 15-17 | 0.70245 | 0.67128 | 0.031174 | 0.99491 |
16 | 13-15 | 0.70848 | 0.67654 | 0.031944 | 0.99215 |
17 | 11-13 | 0.7143 | 0.68303 | 0.031267 | 0.99131 |
18 | 9-11 | 0.71683 | 0.68709 | 0.029739 | 0.99563 |
19 | 7-9 | 0.72001 | 0.69027 | 0.029733 | 0.99121 |
20 | 5-7 | 0.71558 | 0.68342 | 0.032161 | 0.98735 |
Table 3.2 Consistency analysis results in the low tide stage.
Seq. No. of layer
| Water layer depth (m) | Mean 1 (m/s) | Mean 2 (m/s) | Error value (m/s) | Correlation coefficient |
1 | 43-45 | 0.35739 | 0.35839 | -0.001 | 0.99256 |
2 | 41-43 | 0.41293 | 0.41057 | 0.0023607 | 0.99703 |
3 | 39-41 | 0.38869 | 0.38733 | 0.0013607 | 0.99371 |
4 | 37-39 | 0.40875 | 0.40648 | 0.0022787 | 0.99667 |
5 | 35-37 | 0.4092 | 0.40689 | 0.0023115 | 0.99512 |
6 | 33-35 | 0.41851 | 0.416 | 0.0025082 | 0.99753 |
7 | 31-33 | 0.4262 | 0.42333 | 0.0028689 | 0.99837 |
8 | 29-31 | 0.43657 | 0.43333 | 0.0032459 | 0.99975 |
9 | 27-29 | 0.44336 | 0.44003 | 0.0033279 | 0.99999 |
10 | 25-27 | 0.45015 | 0.44664 | 0.0035082 | 0.99737 |
11 | 23-25 | 0.45625 | 0.45251 | 0.0037377 | 0.99553 |
12 | 21-23 | 0.46189 | 0.45815 | 0.0037377 | 0.99529 |
13 | 19-21 | 0.46503 | 0.46166 | 0.003377 | 0.99224 |
14 | 17-19 | 0.46987 | 0.46651 | 0.0033607 | 0.99008 |
15 | 15-17 | 0.47311 | 0.4702 | 0.002918 | 0.98787 |
16 | 13-15 | 0.47823 | 0.47564 | 0.0025902 | 0.98572 |
17 | 11-13 | 0.48293 | 0.48077 | 0.0021639 | 0.98371 |
18 | 9-11 | 0.48528 | 0.4837 | 0.0015738 | 0.98245 |
19 | 7-9 | 0.49211 | 0.49102 | 0.0010984 | 0.97855 |
20 | 5-7 | 0.46028 | 0.45718 | 0.0030984 | 0.99392 |
In conclusion, in the measurement of two PandaADCP 300K direct reading devices at the same time and in the same sea area, the flow velocity data have good consistency, and the measurement results are true and reliable, fully proving the reliability and accuracy of the adcp current profiler.
4. The Conclusion of China Sonar PandaADCP Zhoushan Test - Excellent ADCP Performance and Reliable Results
In this test, two PandaADCP-DR-300K-1000m devices from China Sonar successfully completed the two-day ocean current observation task in the Dinghai sea area of Zhoushan. Through data analysis, it is found that this adcp current profiler can accurately measure ocean current information such as flow velocity and flow direction, and reveal the laws of its changes with time and depth. The measurement results are highly consistent with the actual situation, and the measurement data of the two devices show good consistency. This indicates that the PandaADCP 300kHz has excellent current measurement performance, and the measurement results are true and reliable, which can meet the needs of ocean current field observation.
PandaADCP 300kHz Direct Reading ADCP Analysis Report