1.
An Introduction to the Test of Acoustic Doppler Current Profiler
China Sonar PandaADCP-DR-300K and Teledyne RD Instruments Workhorse Sentinel ADCP 300KHz undergo bottom-mounted static testing. Under the same parameter configuration and application environment, the flow measurement results are compared in multiple dimensions. A comprehensive error of less than 2% indicates basically consistent performance.
1.1 Test Time
From March 21, 2023 to March 23, 2023, lasting for three days.
1.2 Test Location
Southeast Lake District, Qiandao Lake Town, Chun'an County:
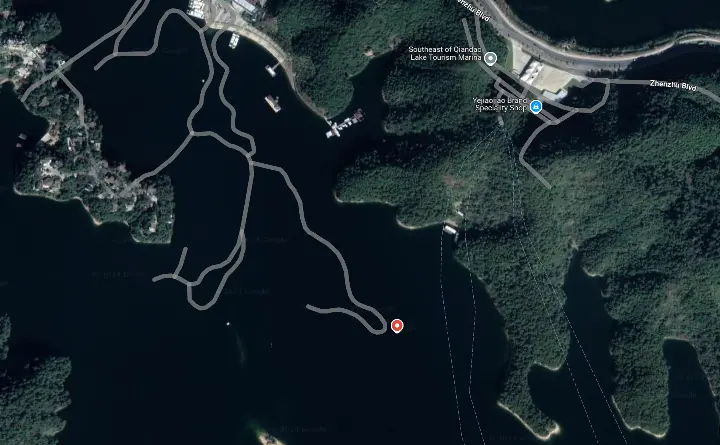
Figure 1.2 Location of Southeast Lake Pier in Qiandao Lake
1.3 Test ADCPs
One set of PandaADCP-DR-300kHz;
One set of Workhorse Sentinel ADCP 300kHz;
One set of GPS;
Two sets of mobile batteries.
1.4 Test Method
Bottom-mounted test;
2. Test Content
The comparison test of PandaADCP 300kHz and Workhorse Sentinel ADCP 300kHz is a bottom-mounted test method. In the bottom-mounted test, two ADCPs are installed on the support frame and alternately transmit for comparison.
2.1 Test Process
The water depth in the static test area is about 70 meters. The deployment area is confirmed by PandaADCP 300kHz after scanning the lake. The scanning result is shown in the following figure.
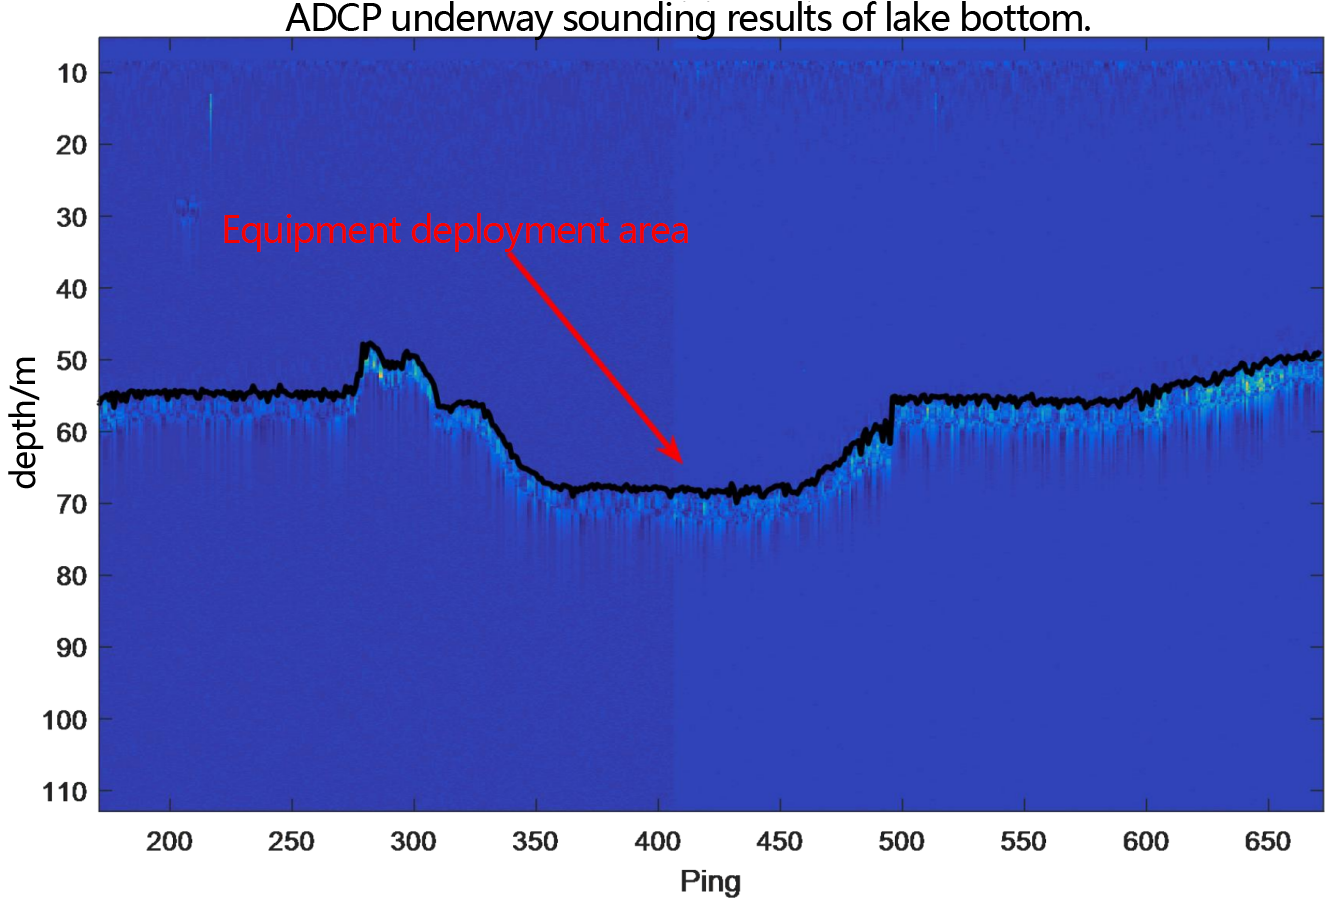
Figure 2.1.1 Equipment deployment area diagram
At 10:30 am on March 21, 2023, start preparing the equipment and materials of PandaADCP-DR-300K and Workhorse II Sentinel ADCP-300K. To ensure that the ADCP starts working after being placed in water, set the start time of PandaADCP 300kHz to 1.5 hours later, that is, officially start at 12:00. This also leaves enough time for installation on the support frame and driving to the test environment.
This test uses an alternating working method to ensure that each ADCP works once every five minutes. Now set the start time of PandaADCP-DR-300K as 12:00, then the start time of WHS300 is 12:07. The first output result of the two ADCPs is calculated according to the operation cycle (2s) * the number of flow measurement pings (150 times), which is 5 minutes. After the first output result, each subsequent output time runs according to the working cycle TB (set to 15 minutes). The working time of the two ADCPs is not less than 24 hours.
Materials for installation preparation: batteries, cables, PandaADCP-DR-300K, Workhorse Sentinel ADCP 300K, fixed copper studs and nuts for ADCP, rubber pads, Kevlar ropes, floating balls, and bottom-mounted support frames.
Drill assembly holes for PandaADCP-DR-300K and Workhorse Sentinel ADCP 300K in advance for assembling ADCP. First, align the rubber pad and the equipment hole positions, then fix them with studs of suitable length, and then assemble two nuts for each stud to prevent loosening and equipment falling off. Firmly fix the battery compartment in the corresponding position with Kevlar ropes, and then connect PandaADCP-DR-300K and the battery with cables. Note that the forward directions of the two devices must be completely consistent. At this time, the ADCP is completely prepared. Then firmly tie the ropes at the four corners of the support frame and ensure it is horizontal to prevent overturning when placed at the bottom of the lake.
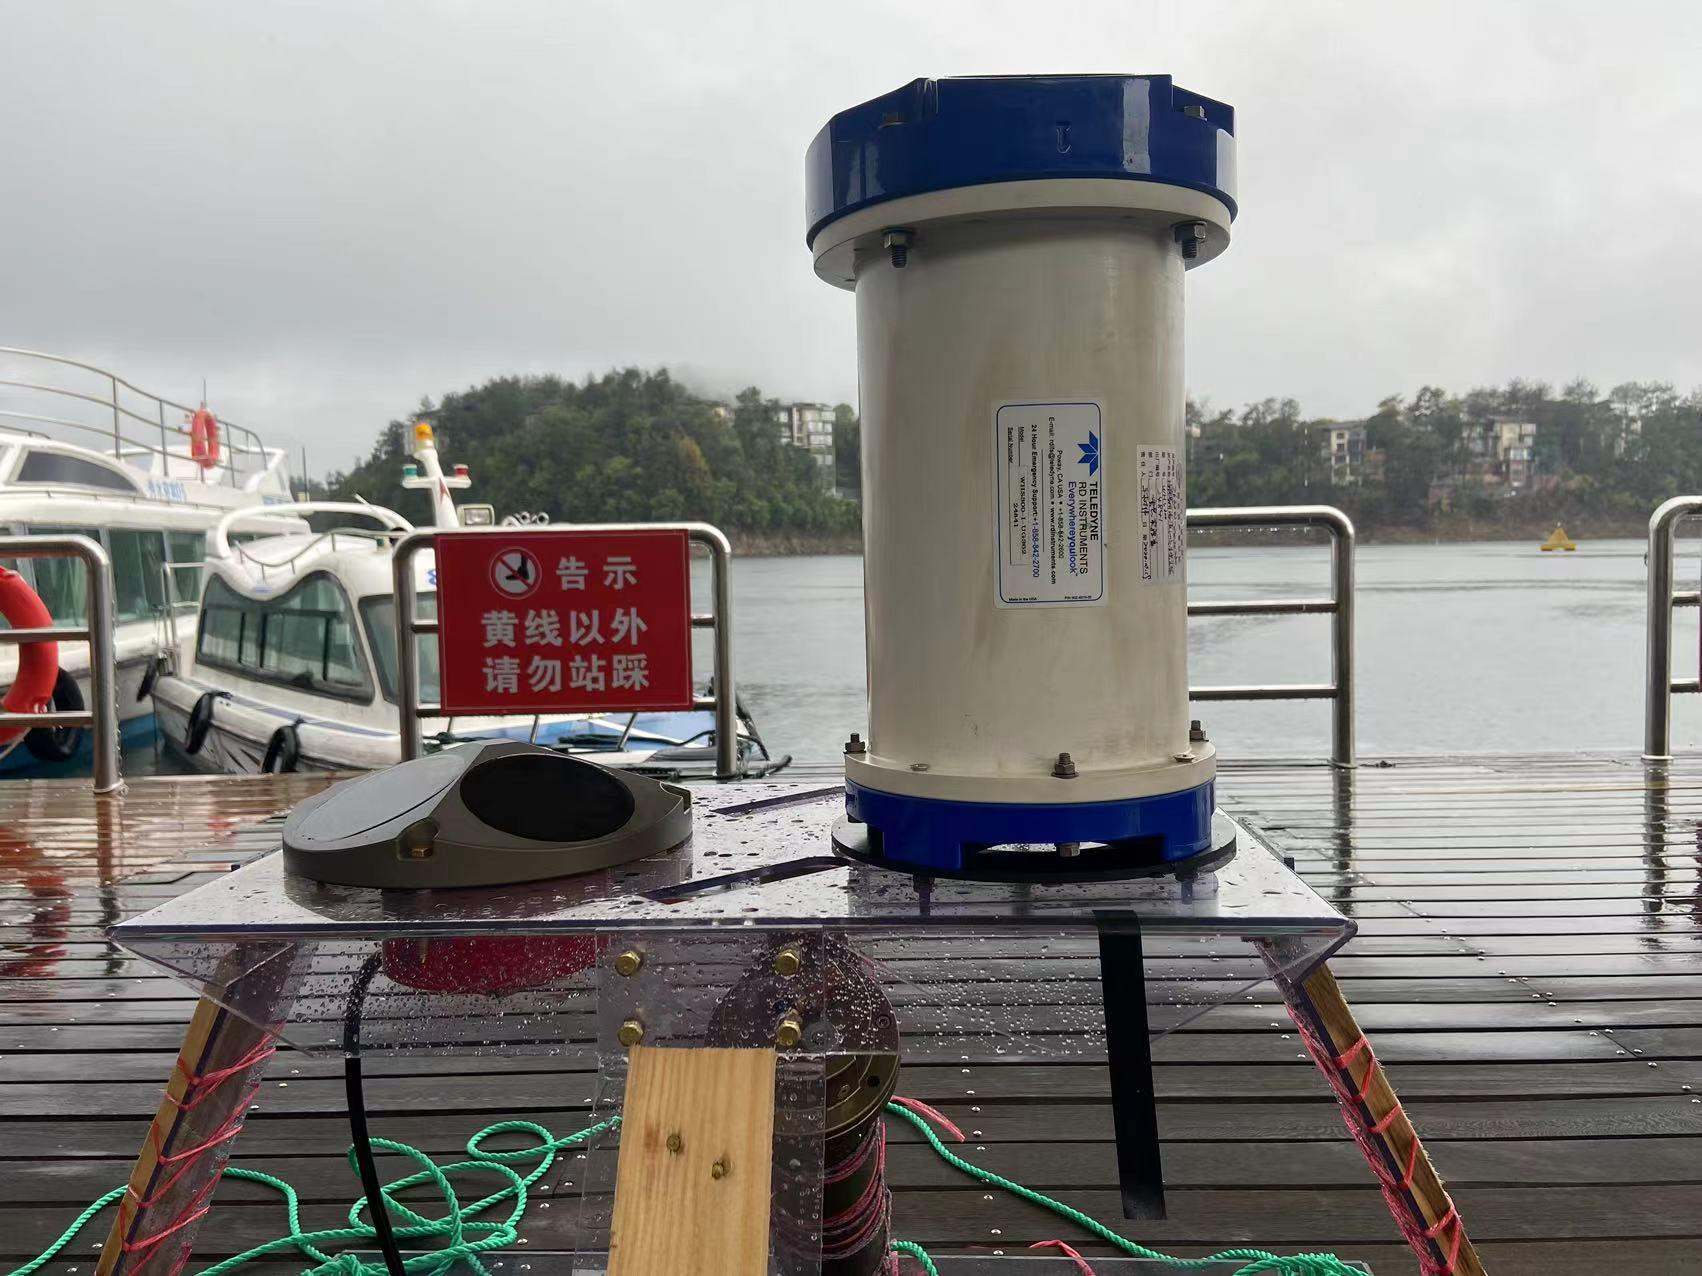
Figure 2.1.2 Installing equipment at the pier
The completion time of preparation at the pier is 11:23. Put the entire support frame on the boat and drive to the test area;
Arrive at the test area at 11:40 and start putting the ADCP into the lake;
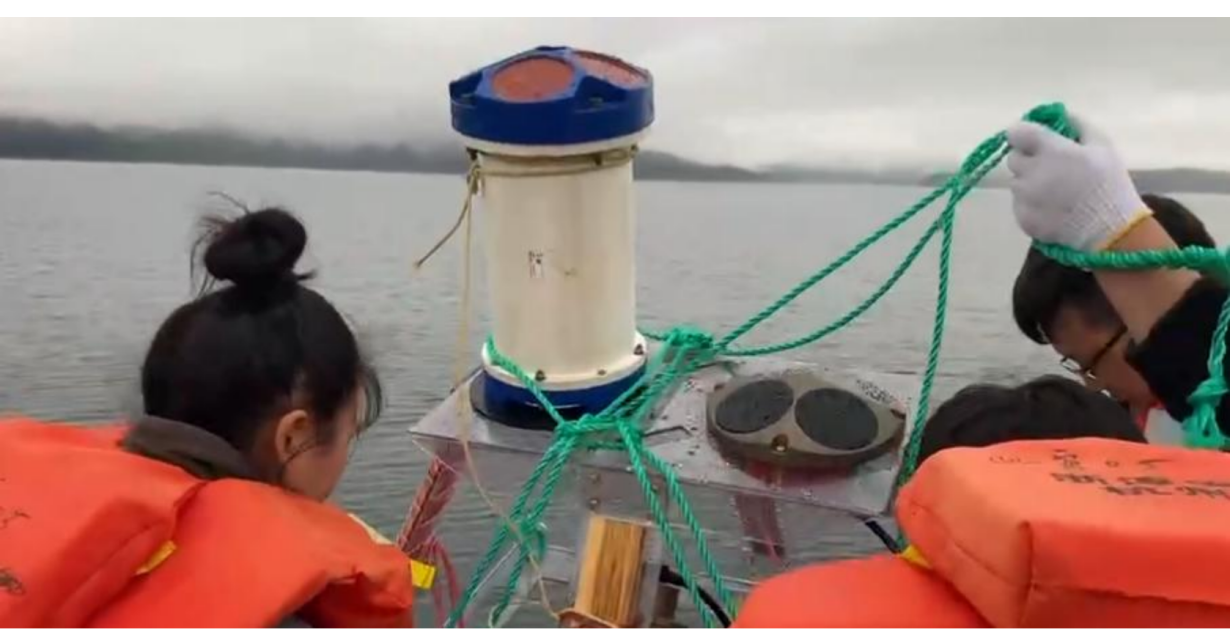
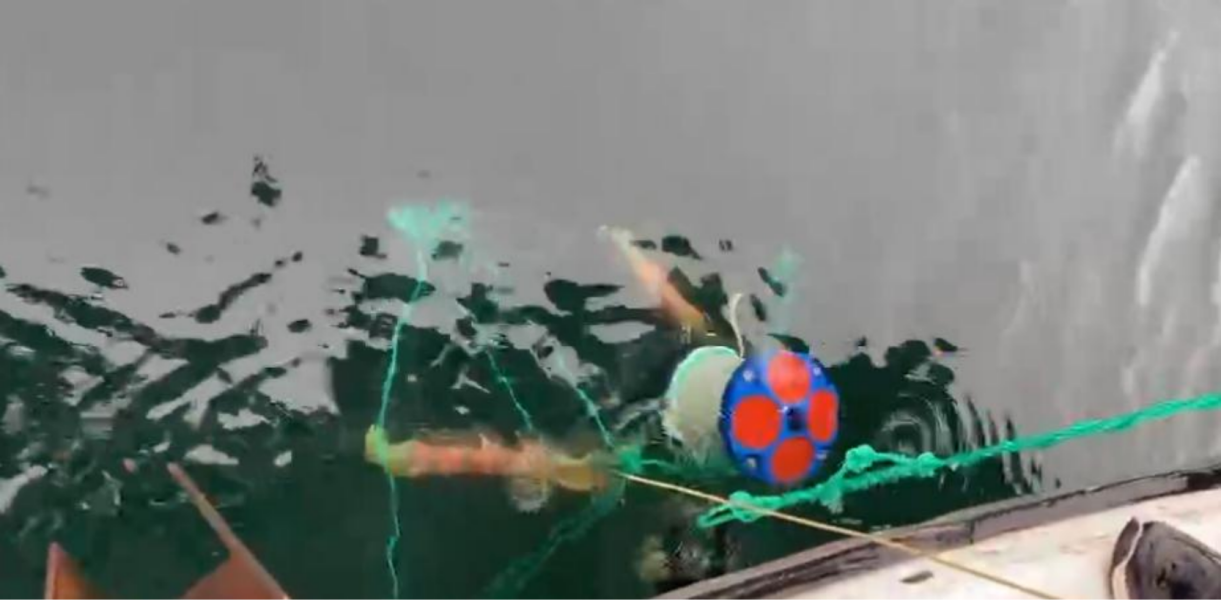
Figure 2.1.3 ADCP deployment
As soon as the ADCP reaches the bottom of the lake, the floating ball can be put into the lake. The rope of the support frame is connected to the floating ball. When retrieving, just find the position of the floating ball.
At 13:00 on March 21, 2023, go to the test site to retrieve the ADCP;
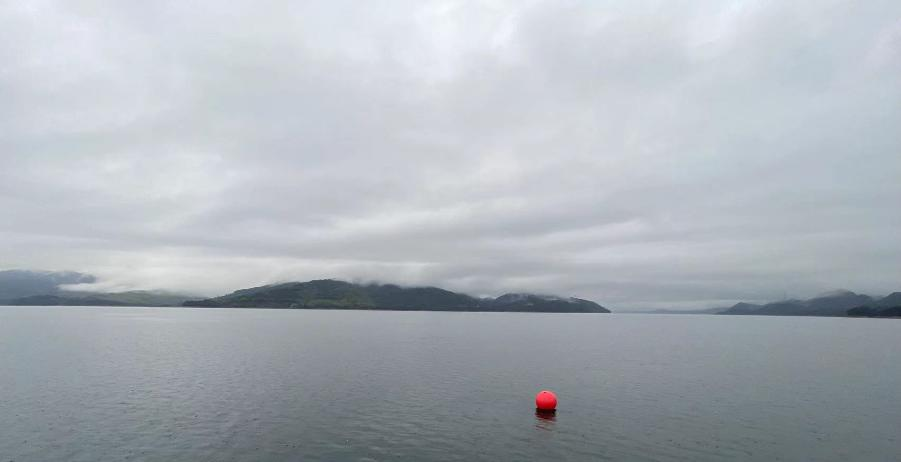
Figure 2.1.4 Location of floating ball (equipment)
Note: Parameter configuration
PandaADCP-DR-300K start time TG: March 21, 2023, 12:00:00
Workhorse Sentinel ADCP 300K start time TG: March 21, 2023, 12:07:00
Table 1. Parameter configuration table

Definition:
EU: Set the device orientation (1 - upward, 0 - downward);
TB: Set the interval between pings, that is, the working cycle;
TP: Set the interval between pings, that is, the transmission cycle;
WP: Set the number of pings for flow measurement;
WN: Set the number of layers; WS: Set the layer thickness;
EX: Set the coordinate system. 0x11 represents the geodetic coordinate system; TO: Set the working duration; (used in conjunction with TG)
TG: Set the start time of the device.
2.2 Test Results
Both PandaADCP 300K and Teledyne RD Instruments Workhorse Sentinel ADCP 300K use the PD0 output format. To make the comparison results more accurate, use Matlab to unpack and compare the result data stored by the two ADCPs respectively.
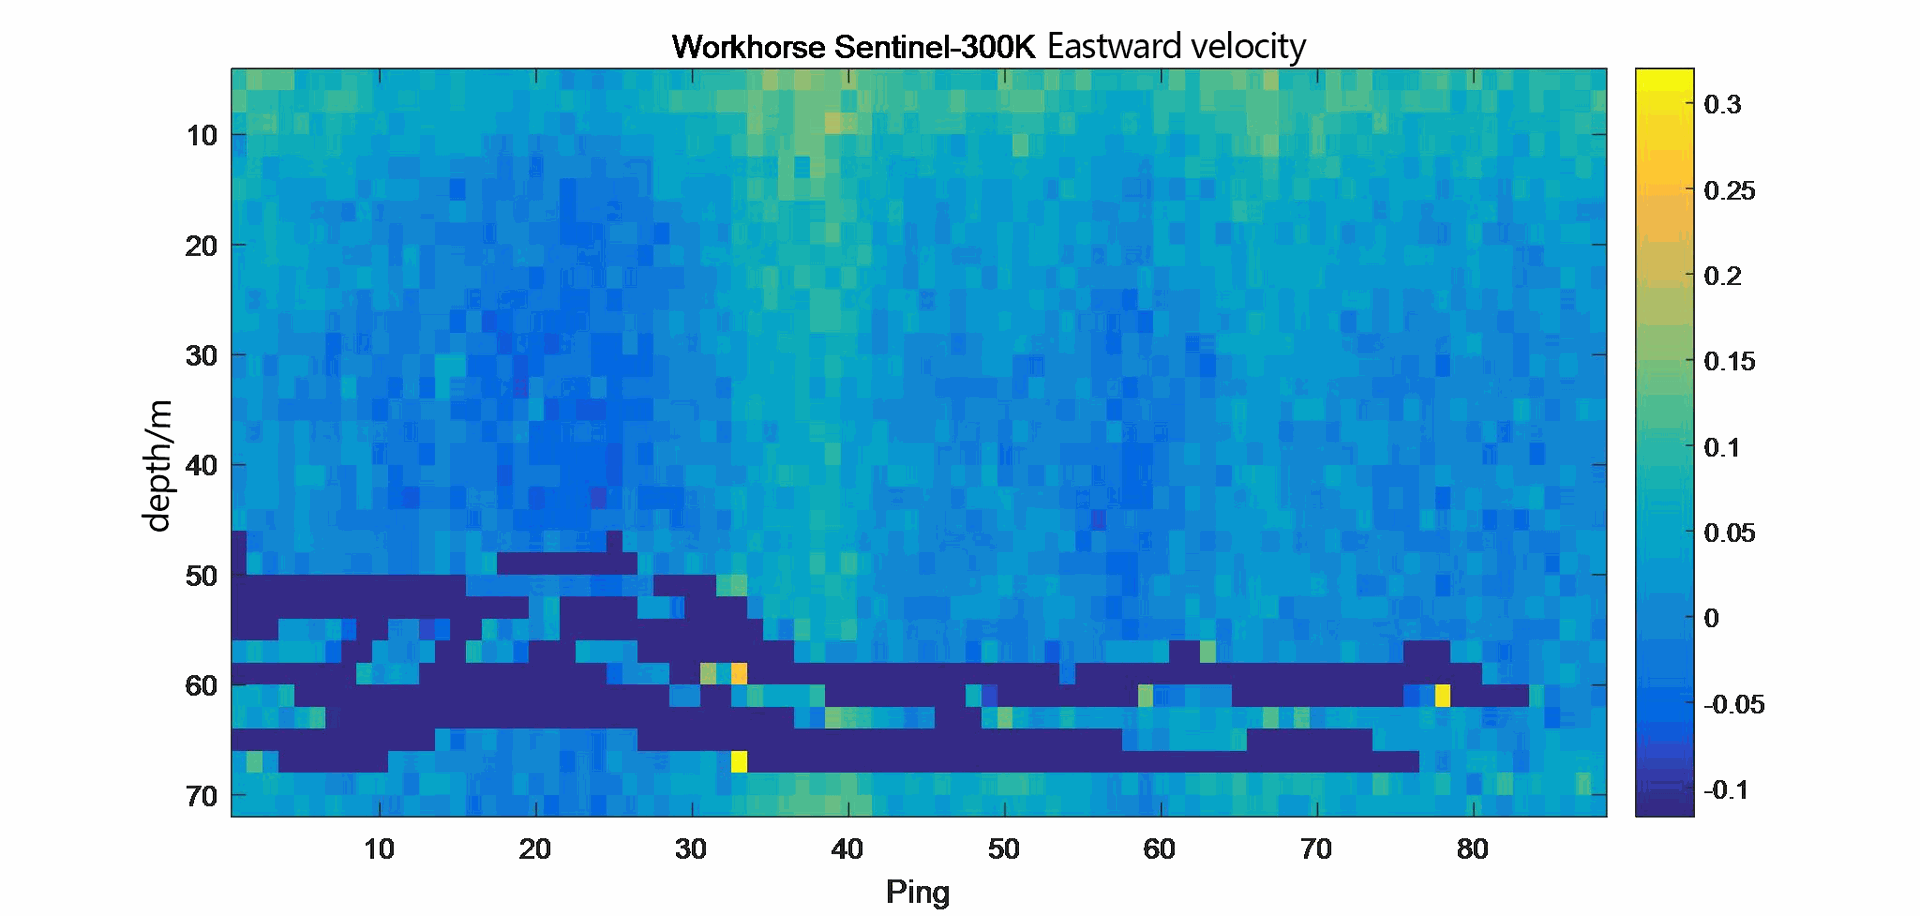
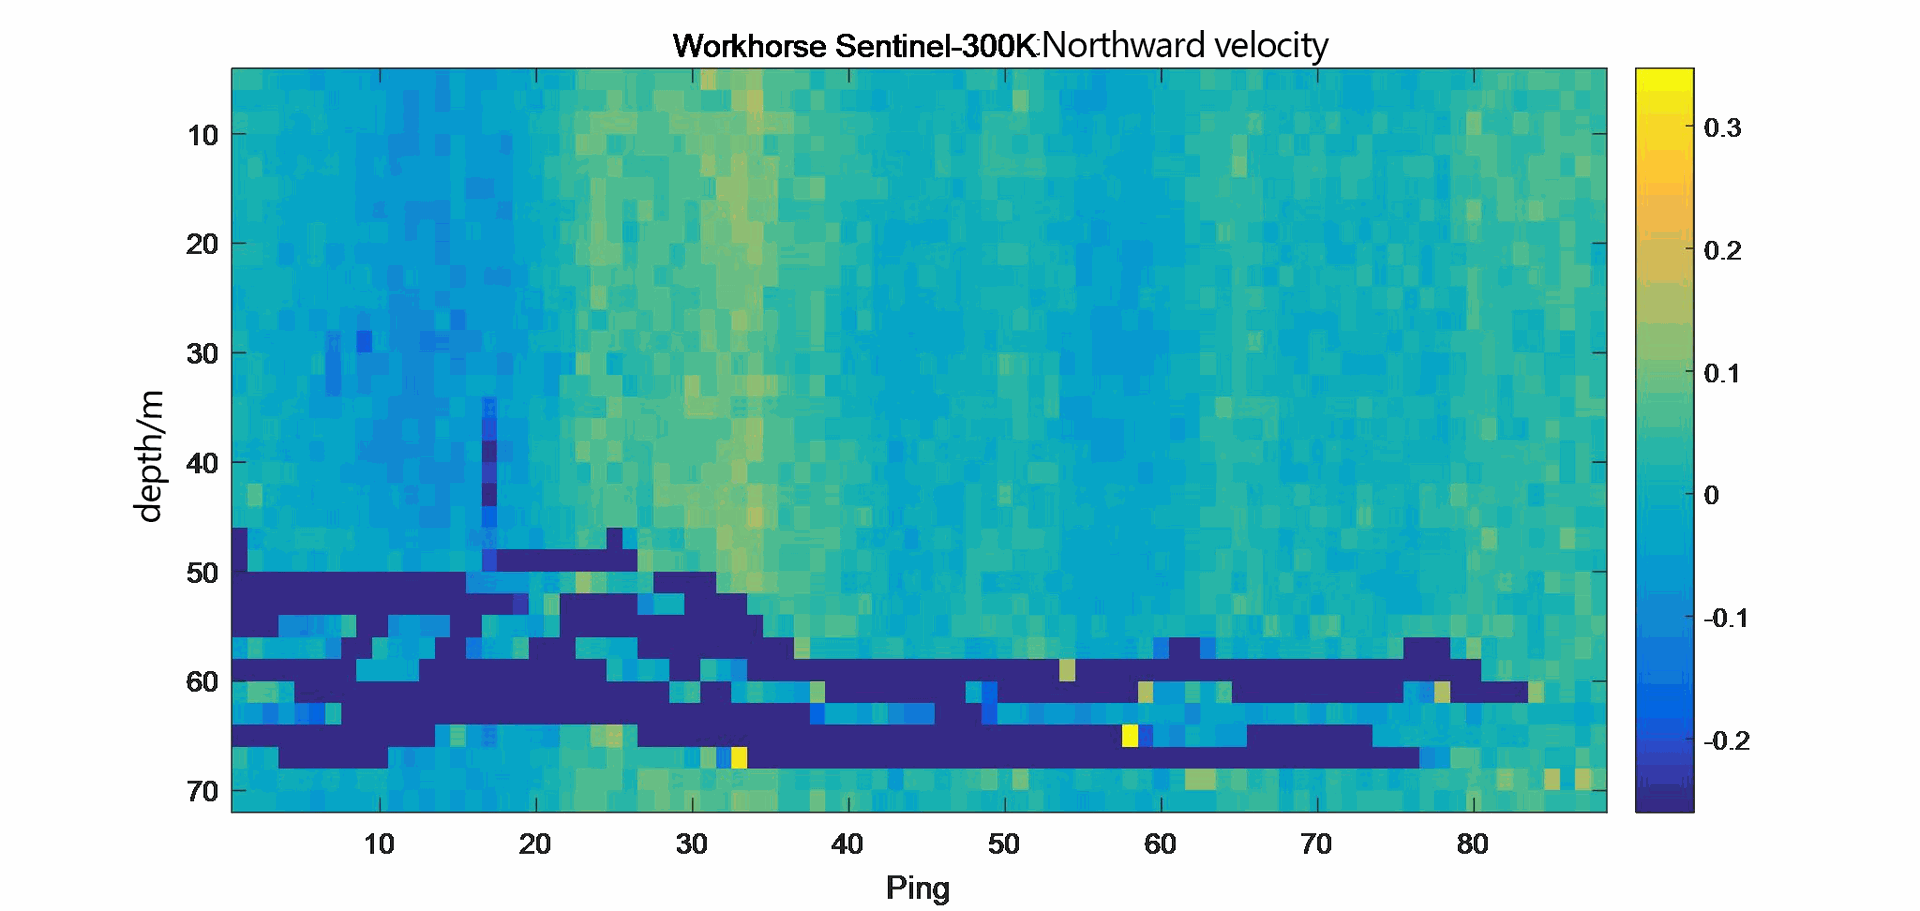
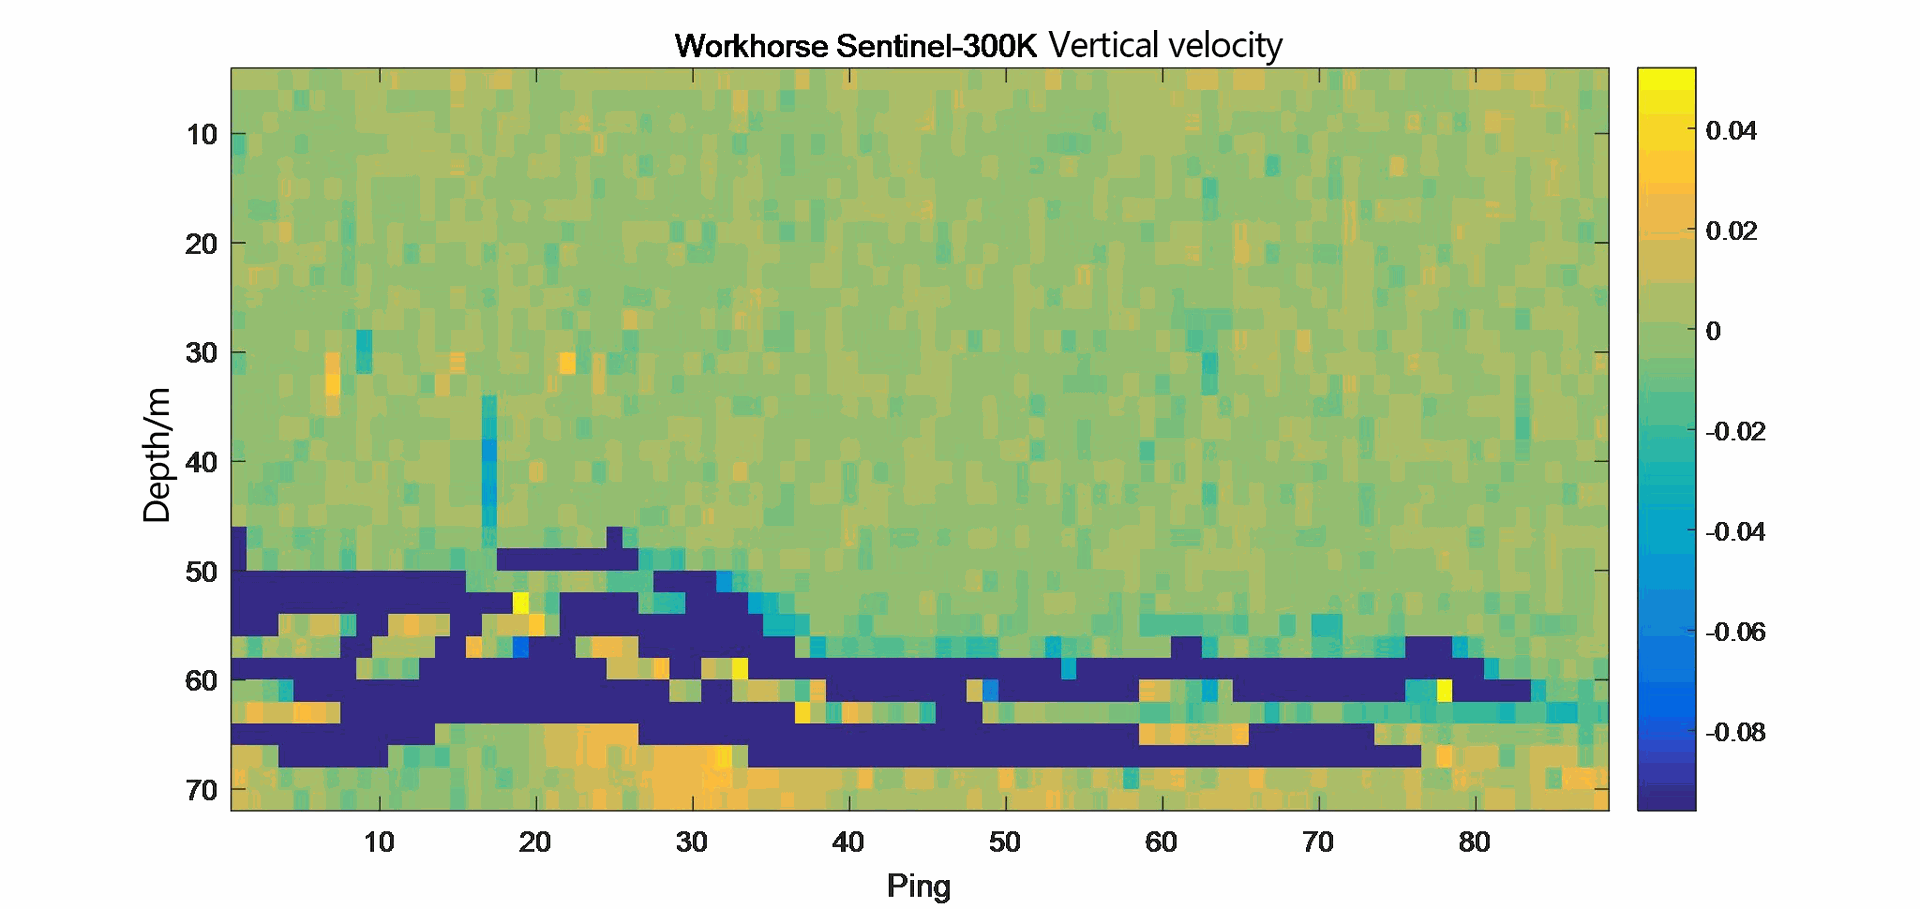
Figure 2.1.5 Static flow measurement result of Workhorse Sentinel ADCP 300K
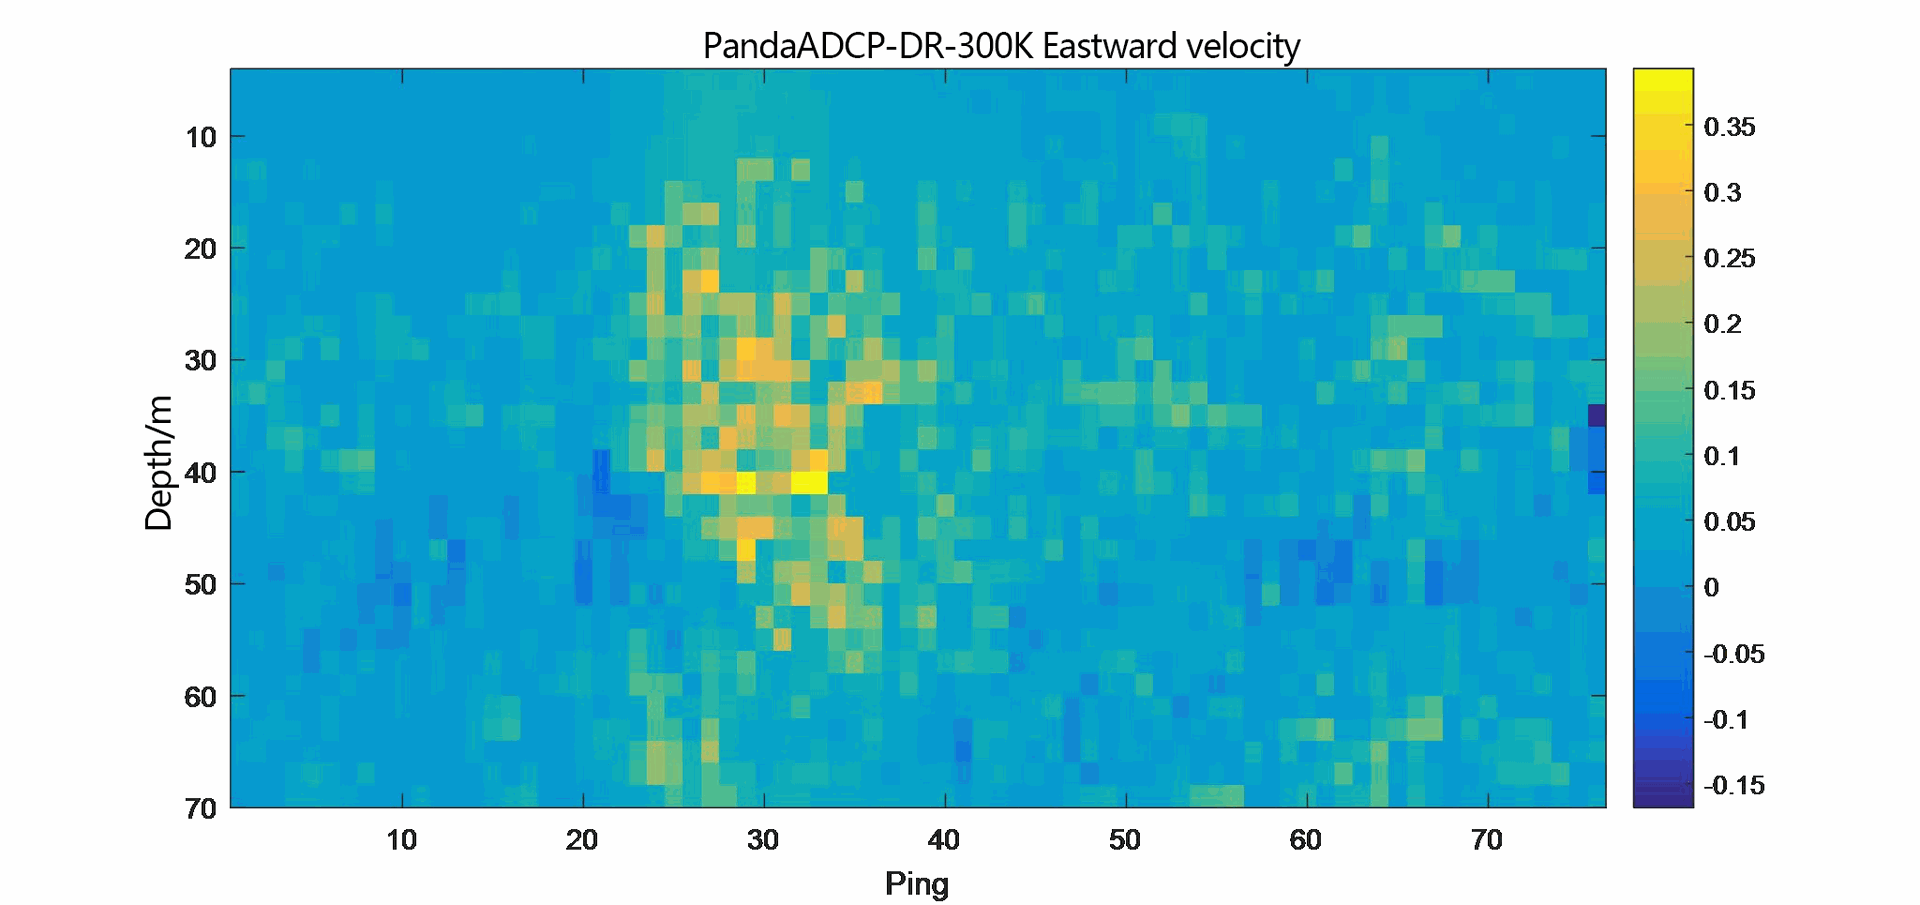
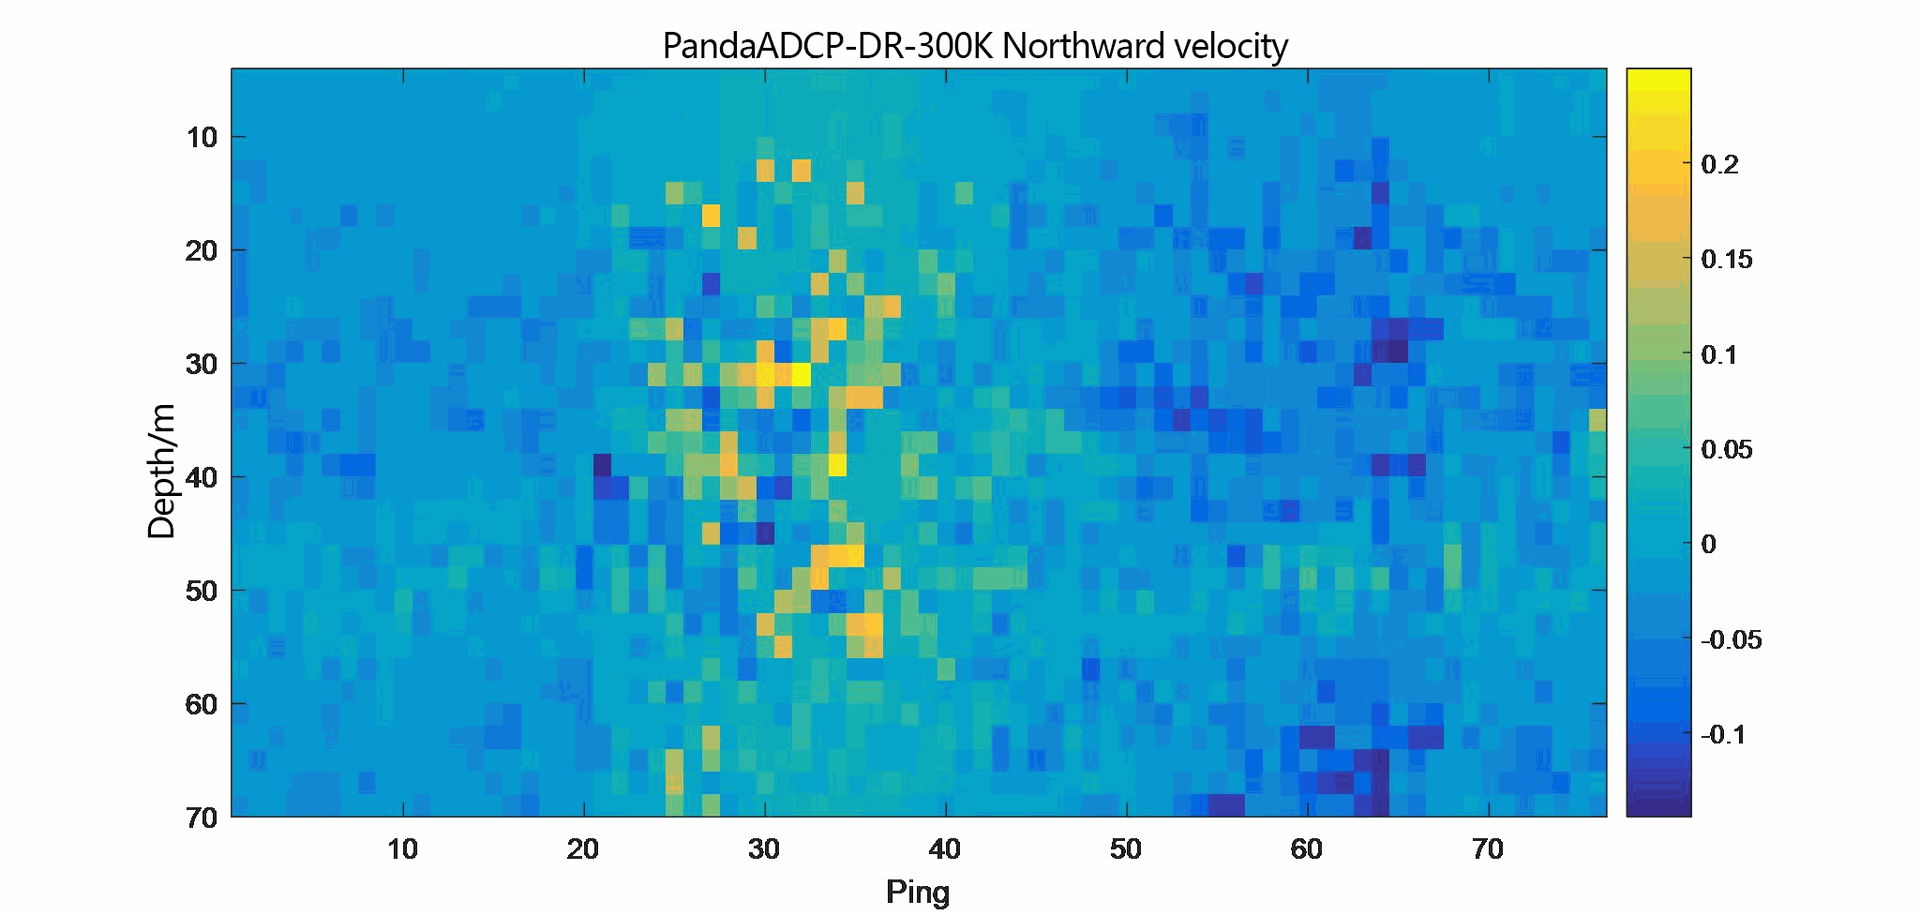
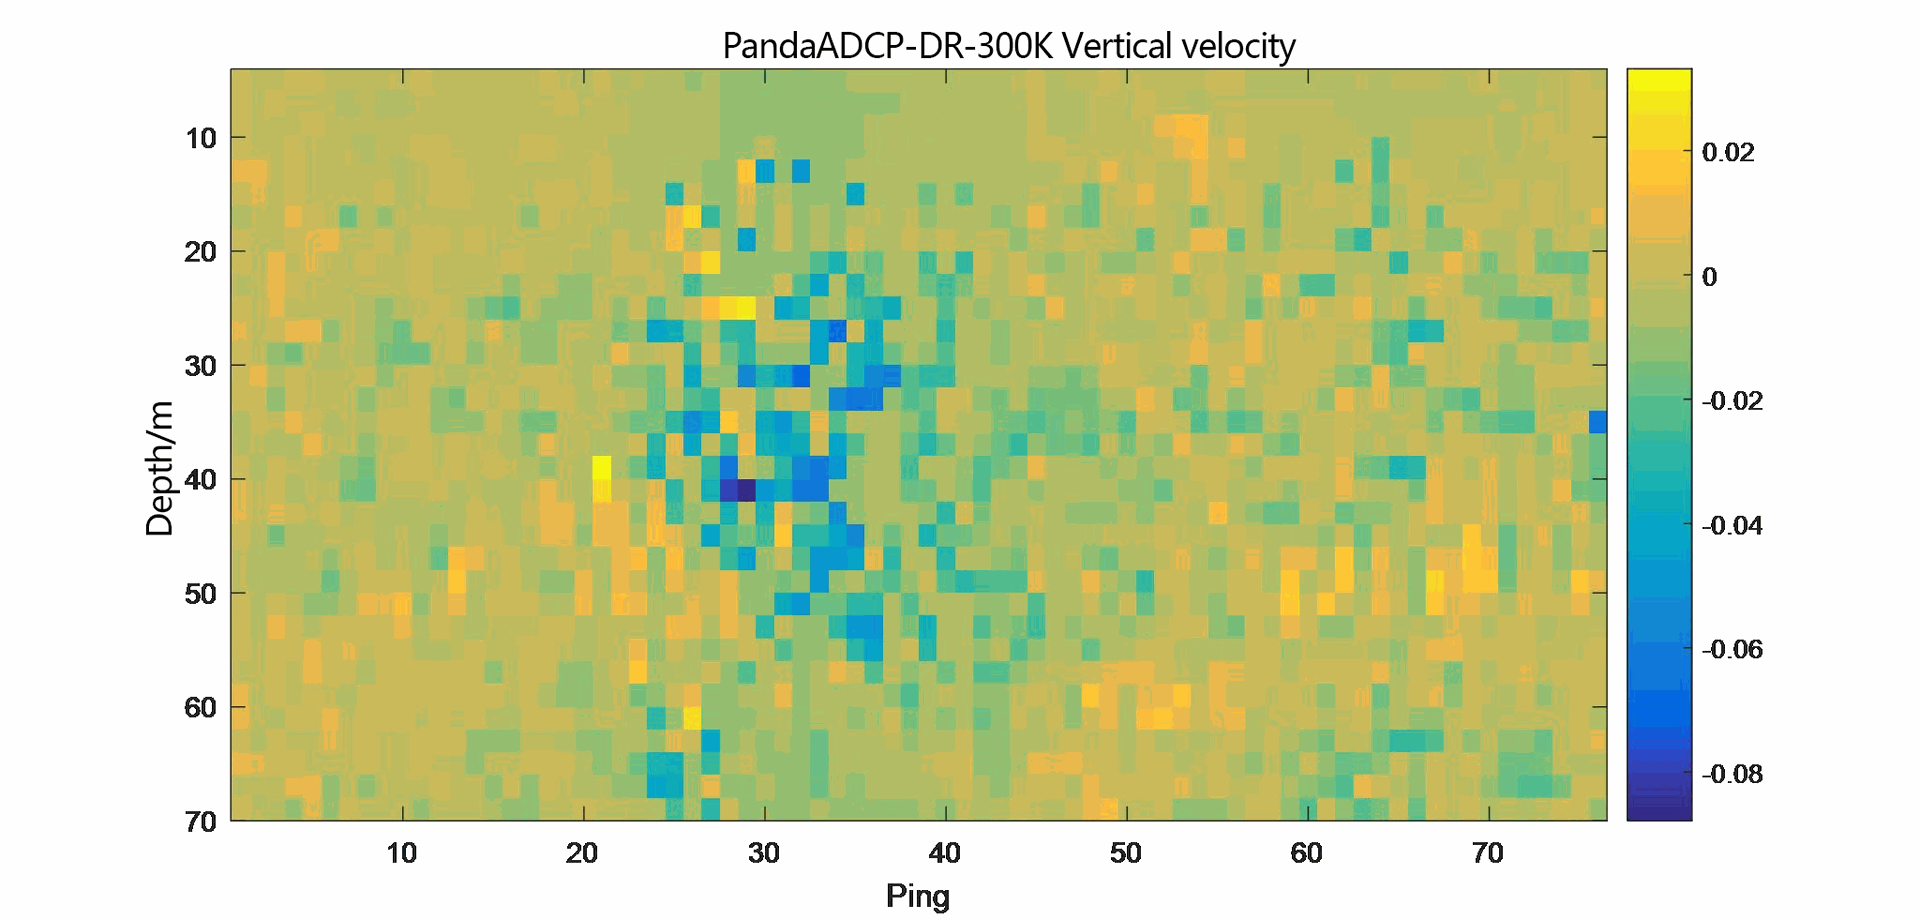
Figure 2.1.6 Static flow measurement result diagram of PandaADCP-DR-300K
As can be seen from the flow measurement result history diagram, the static flow measurement ranges of the two ADCPs are basically the same. The eastward velocity is -0.1m/s to 0.3m/s, the northward velocity is -0.2m/s to 0.3m/s, and the vertical velocity is -0.08m/s to 0.04m/s.
Statistically analyze the results of all flow measurement pings in the three directions respectively. The results are as follows;
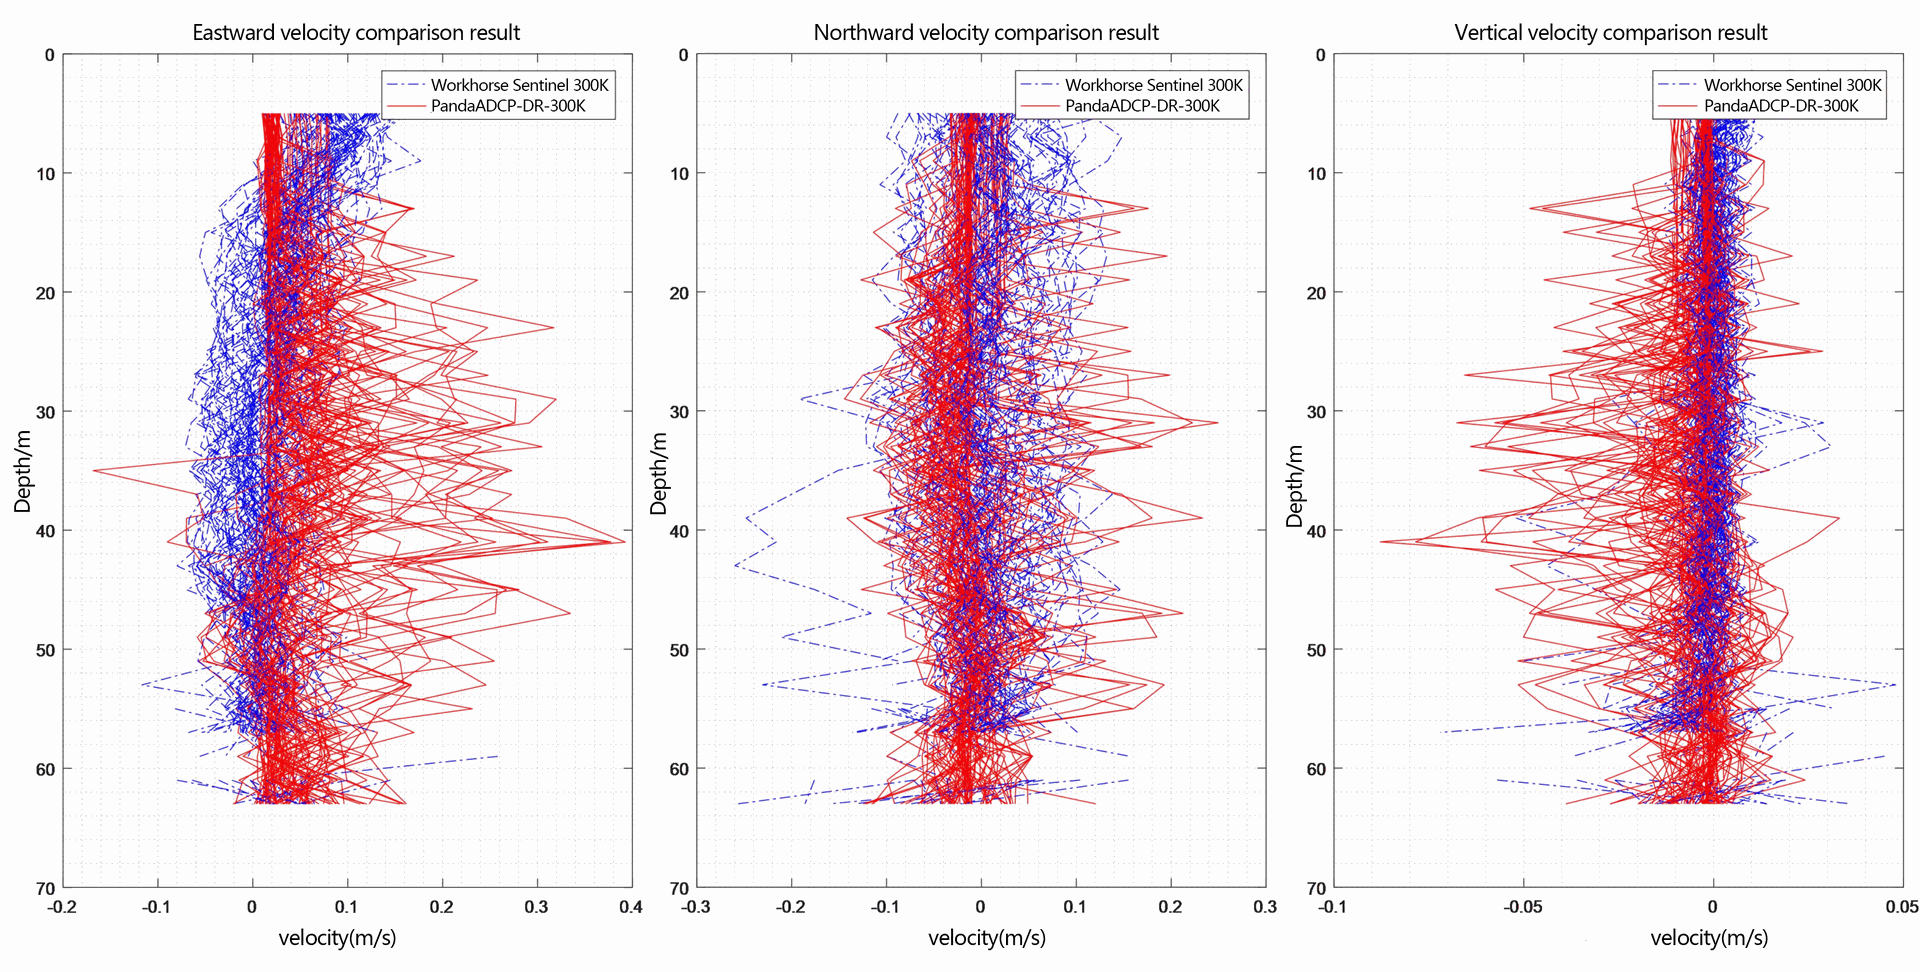
Figure 2.1.7 Flow measurement result diagram of multiple pings in three directions
As can also be seen from the flow measurement result of multiple pings, the static flow measurement ranges of the two ADCPs are basically the same. Finally, statistically calculate the absolute value of the three-direction average error and the error rate of each ping flow measurement, as shown in the following figures.
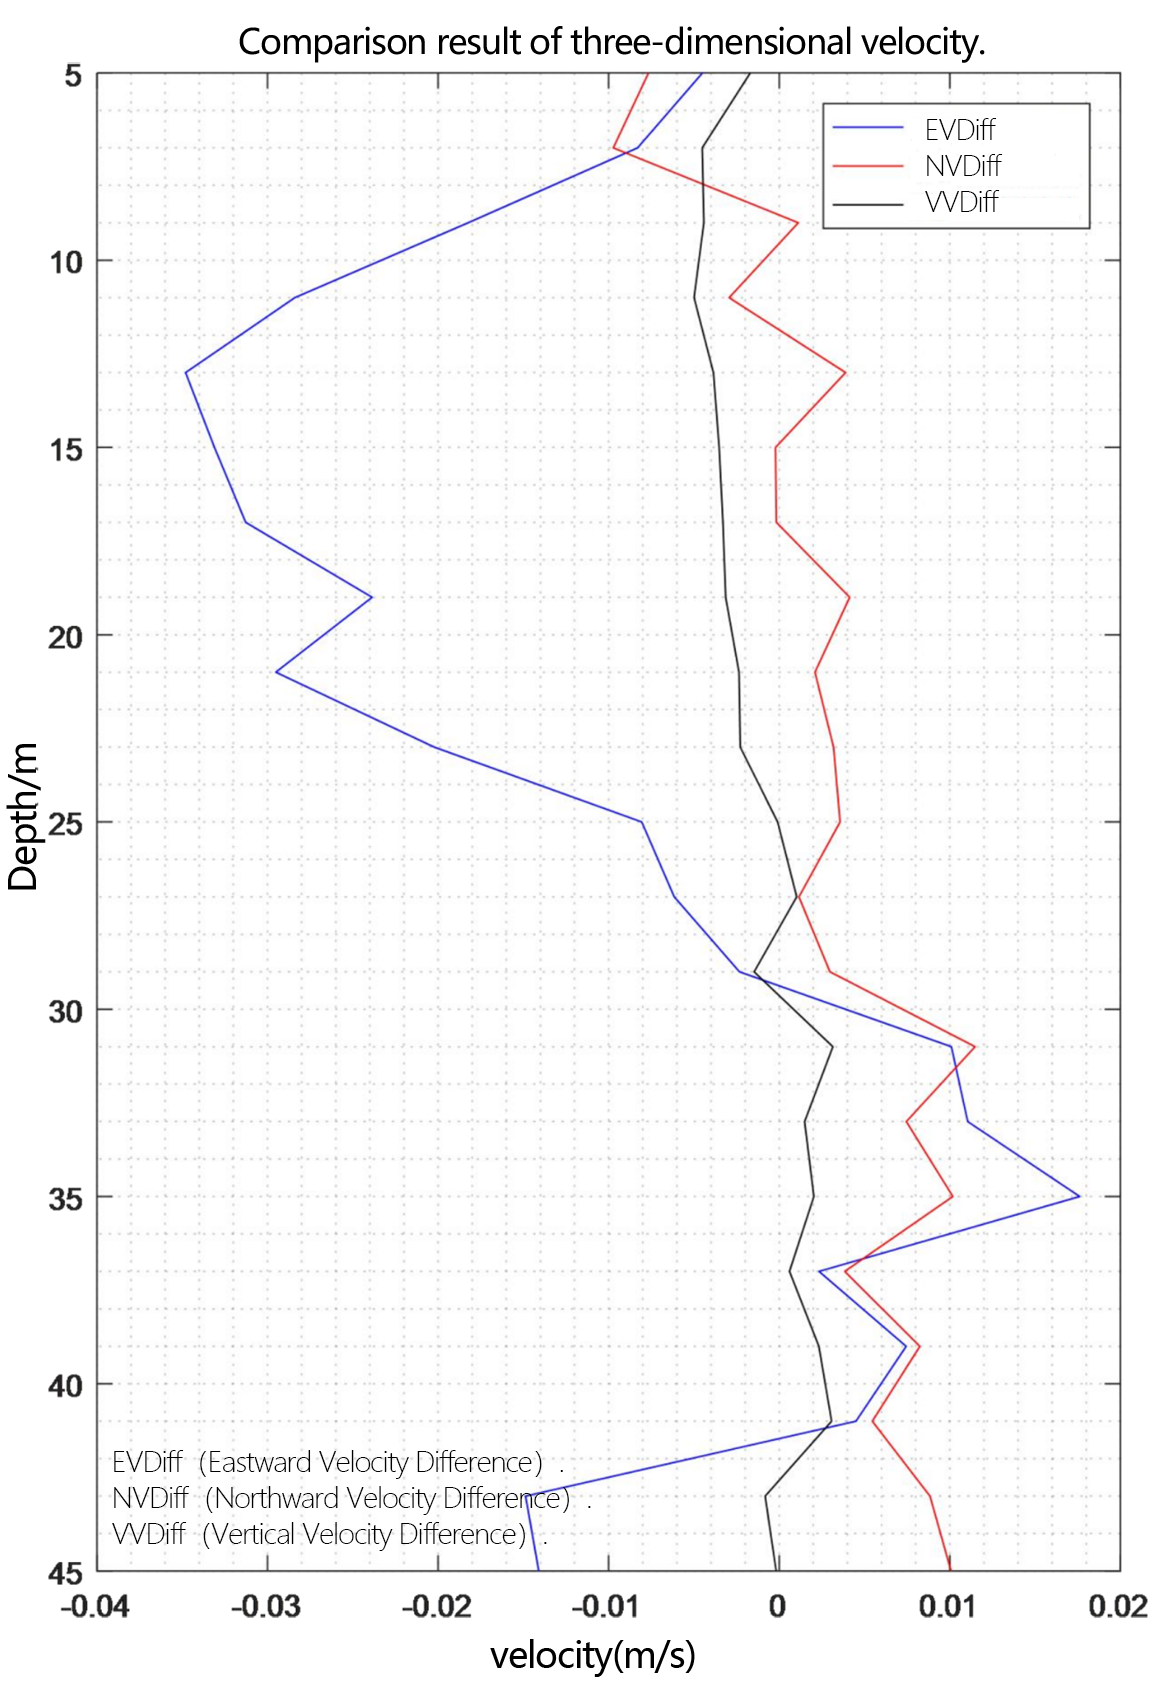
Figure 2.1.8 Relative deviation diagram of three-direction velocity
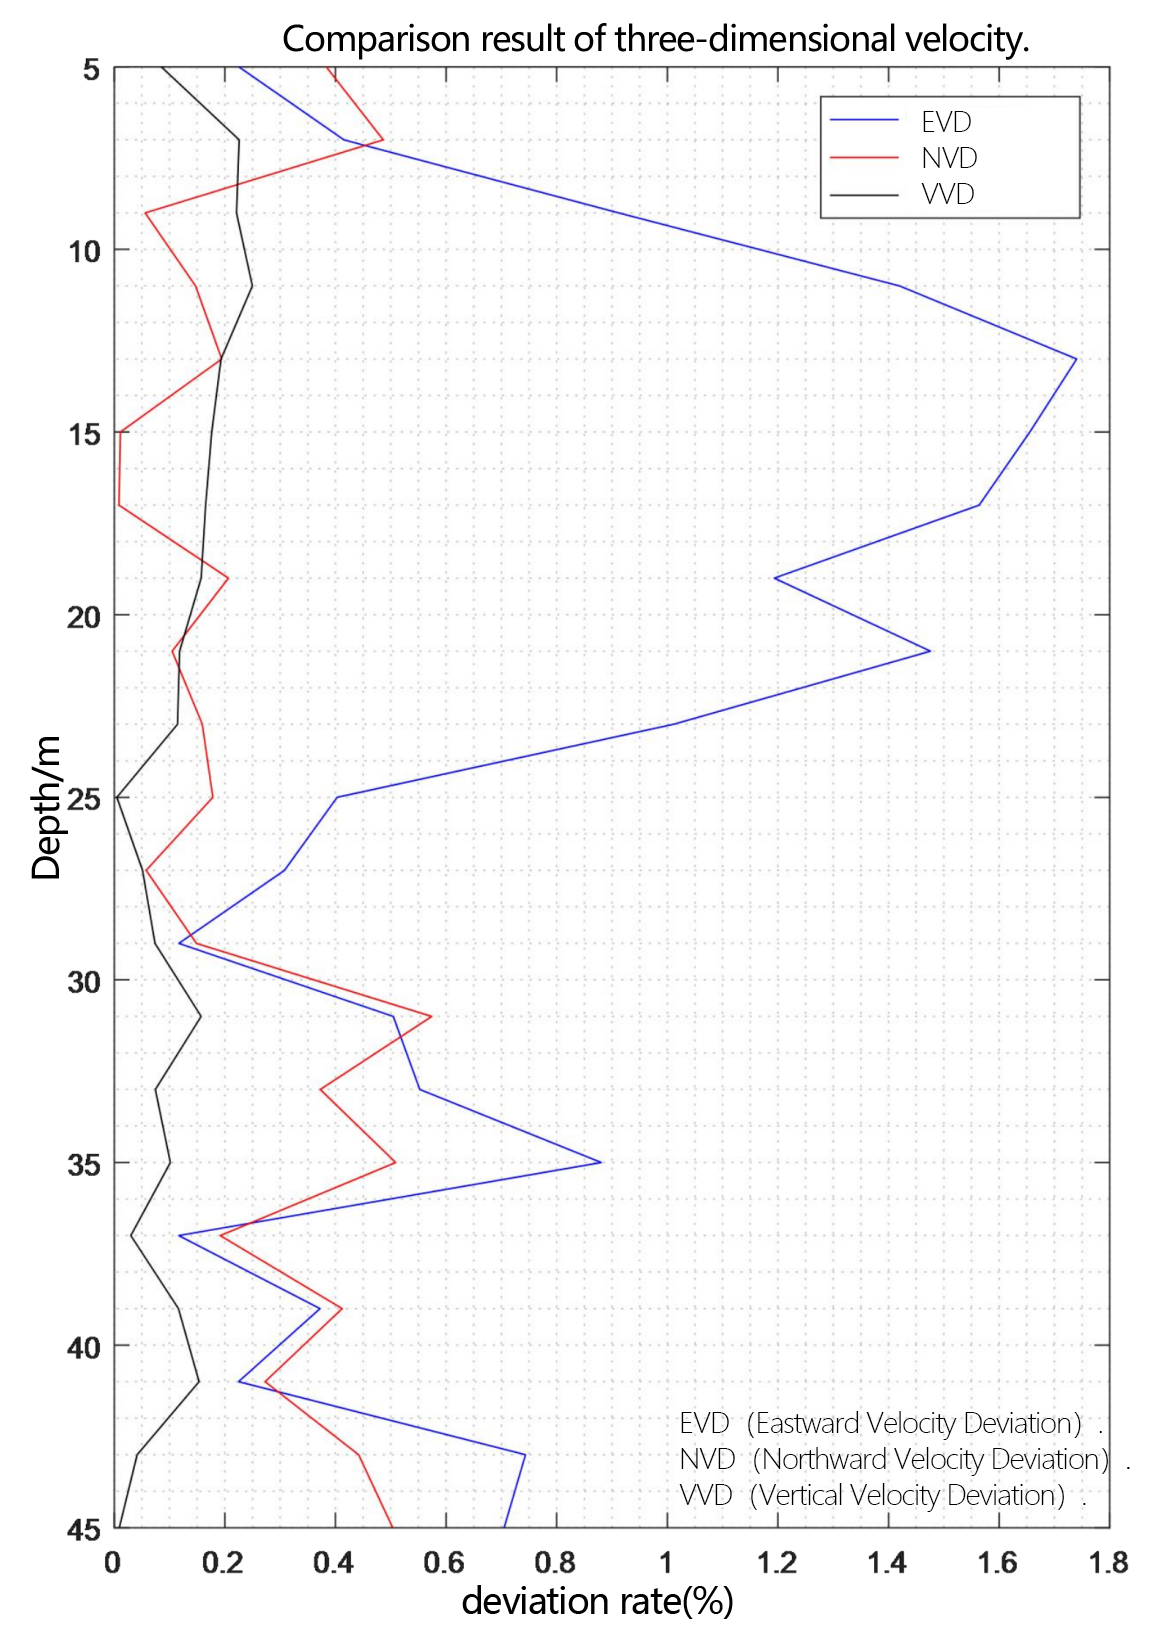
Figure 2.1.9 Deviation rate diagram of three-direction velocity
3. Test Conclusion
In this comparative test, two types of equipment, China Sonar PandaADCP-DR-300K and Teledyne RD Instruments Workhorse Sentinel ADCP 300K, are used to comprehensively compare the flow measurement performance in the bottom-mounted static mode. To accurately compare the measurement performance of the two, use Matlab to analyze and compare the PD0 result data stored by the two types of equipment. The comparison results show that in the static mode, the relative deviation of the water flow velocity values measured by the two is less than 2%.
300kHz ADCP Mooring/Bottom Mounting Comparison Test