1. Test Introduction
China Sonar PandaADCP-DR-300K and Workhorse Sentinel ADCP 300K conduct underway dynamic tests. Under the same parameter configuration and in the same application environment, multi-dimensional comparison of flow measurement results is carried out. A comprehensive error of less than 2% indicates basically consistent performance.
1.1 Test Time
From March 21 to March 23, 2023, for a period of three days.
1.2 Test Location
Southeast Lake District, Qiandao Lake Town, Chun'an County
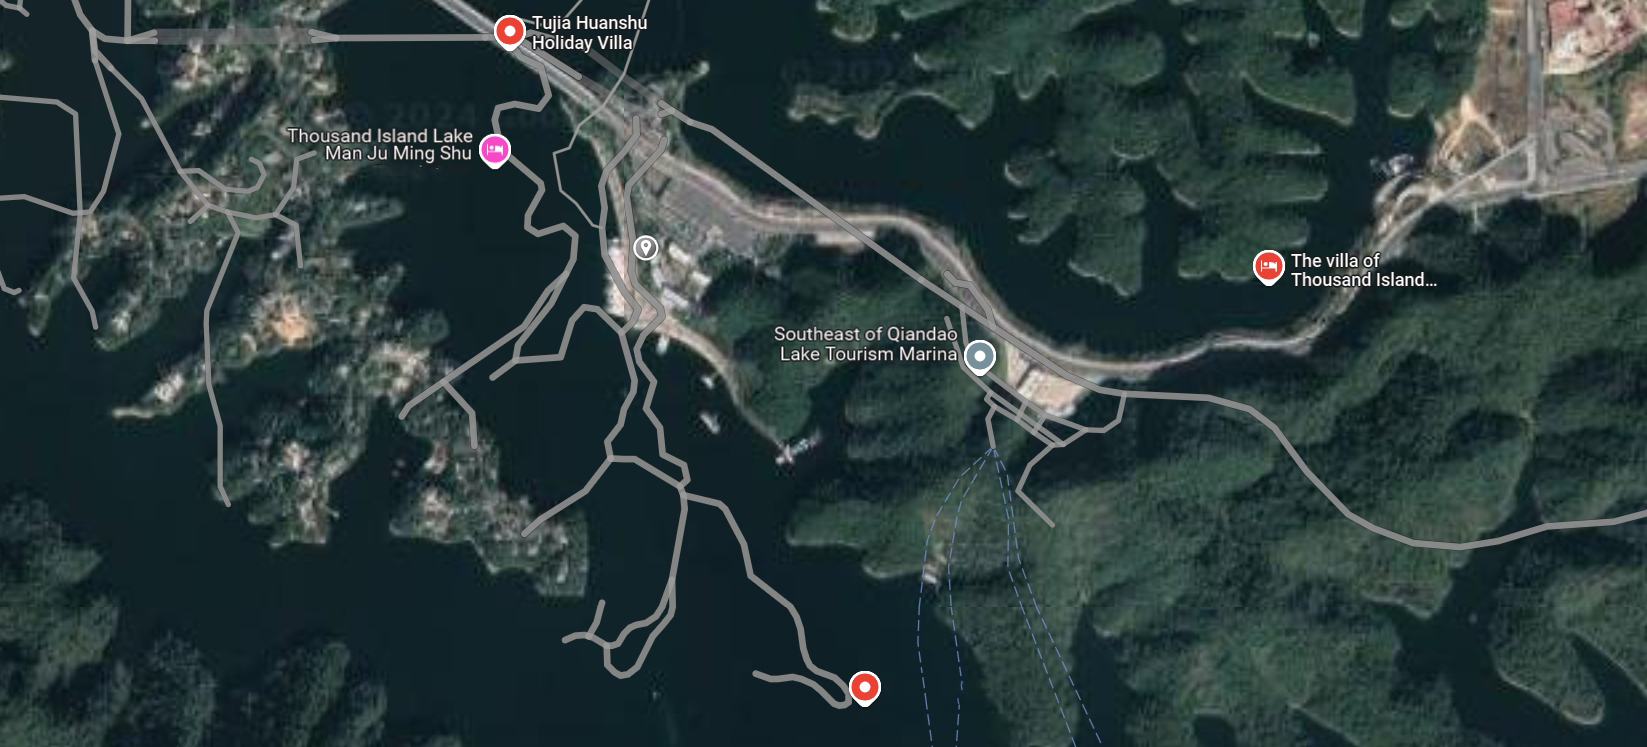
Figure 1.1 Location map of Southeast Lake Wharf in Qiandao Lake
1.3 Test ADCP
One set of PandaADCP-DR-300kHz;
One set of Workhorse Sentinel ADCP 300kHz;
One set of GPS;
Two sets of mobile batteries.
1.4 Test Method
Underway test.
2. Test Content:
The comparison test method of PandaADCP-DR-300K and Workhorse Sentinel ADCP 300K is underway. In the underway test, PandaADCP 300K is installed on the starboard side of the ship, and Workhorse Sentinel ADCP 300K is installed on the port side of the ship. The two still perform comparison tests by alternately transmitting.
2.1 Test Process
At 9:00 am on March 24, 2023, the PandaADCP-DR-300K and Workhorse Sentinel ADCP 300K equipment was fixed. The PandaADCP 300K equipment is installed on the starboard side of the ship, and TRDI ADCP WHS300 is installed on the port side. First, install the ADCP of TRDI. On the wharf, pass its cable through the inside of the fixed pole to prevent the cable from being pulled by the water resistance during navigation. Then install the ADCP and the fixed pole. Install rubber pads between the fixed pole and the ADCP to prevent damage to the surface of the ADCP. When fixing the ADCP, two nuts need to be assembled on each stud to prevent the ADCP from falling off during navigation.
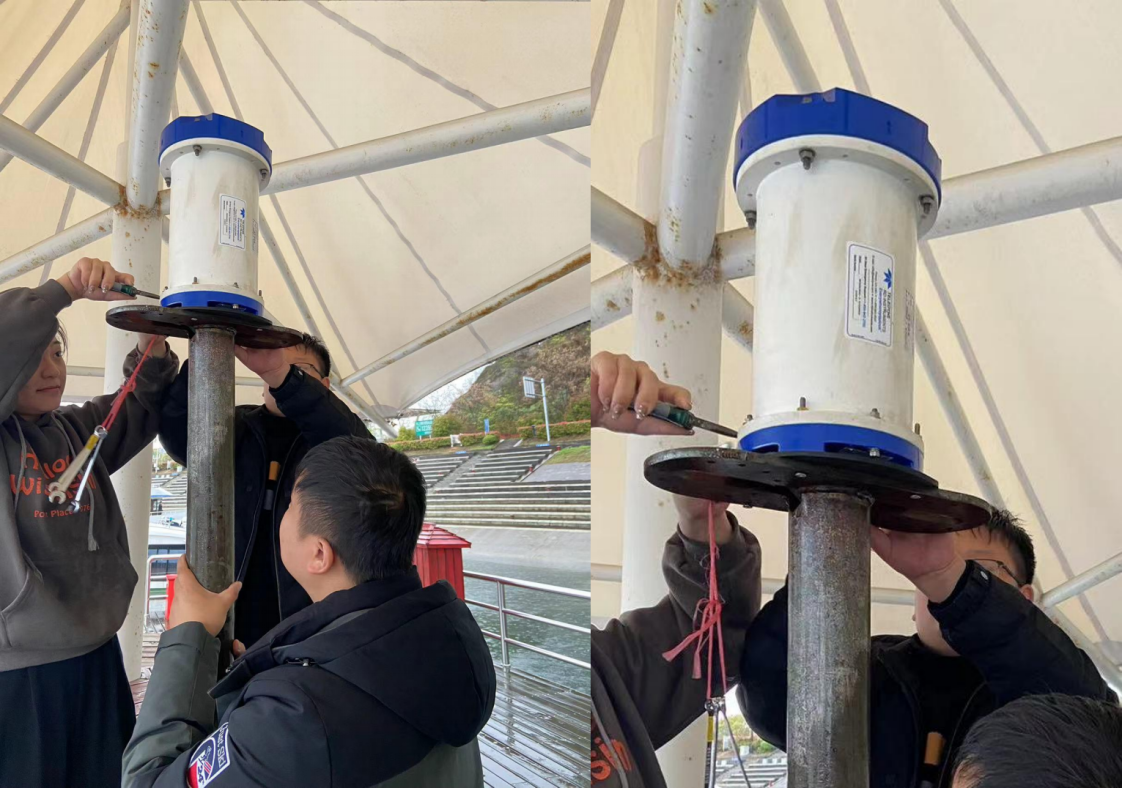
Figure 2.2.1 Installation diagram of Workhorse Sentinel ADCP and fixed pole
After the ADCP and the fixed pole are installed, they need to be fixed to the ship. First, move the fixed pole to the bow of the ship, align the hole positions of the fixed pole and the fixed frame on the ship, and insert an M8 long stud to fix it on the ship. When installing the bolts, pay attention to the cable in the fixed pole. Install bolt nuts in all hole positions to prevent the ADCP from shaking during navigation and thus affecting the accuracy of the measurement data.
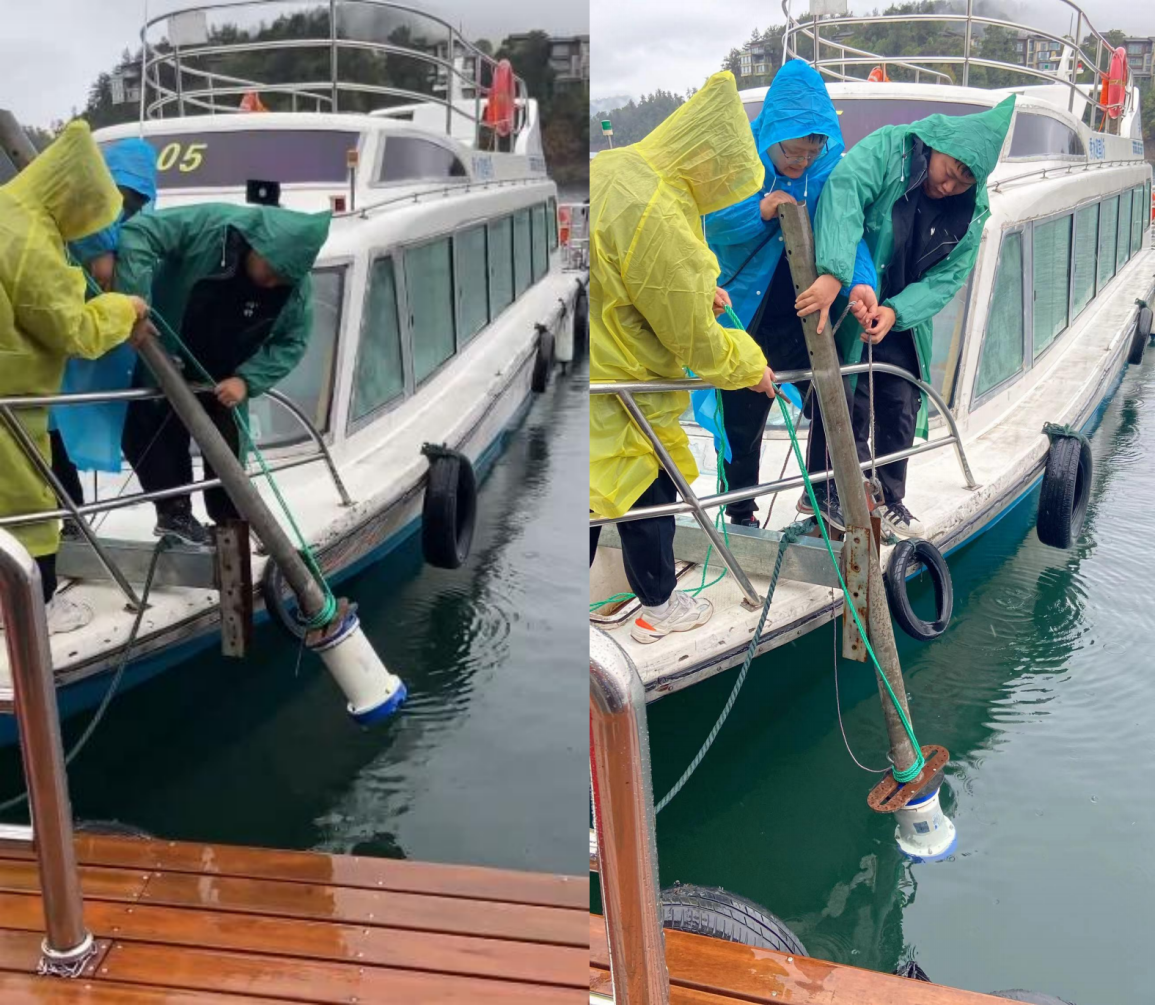
Figure 2.2.2 Installation of Workhorse Sentinel ADCP
The installation of TRDI ADCP was completed at 10:10 am. At this time, the installation of PandaADCP 300kHz began. The operation is the same as that of installing teledyne workhorse adcp 300kHz. Also pass the cable through the fixed pole to prevent the cable from being pulled by excessive water resistance. The different operation is that the fixed pole and the fixed frame on the ship are assembled first, and then the ADCP can be directly installed on the fixed frame. After installation is completed, the equipment can be put into the water.
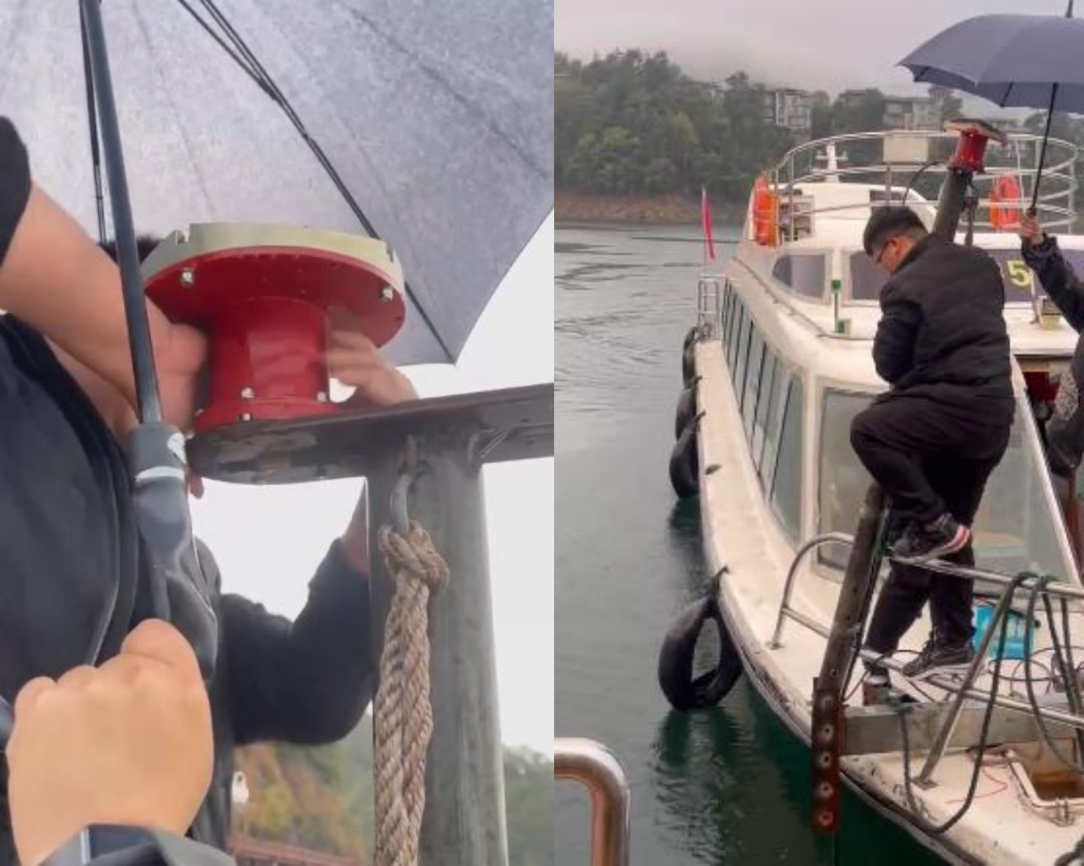
Figure 2.2.3 Installation of PandaADCP
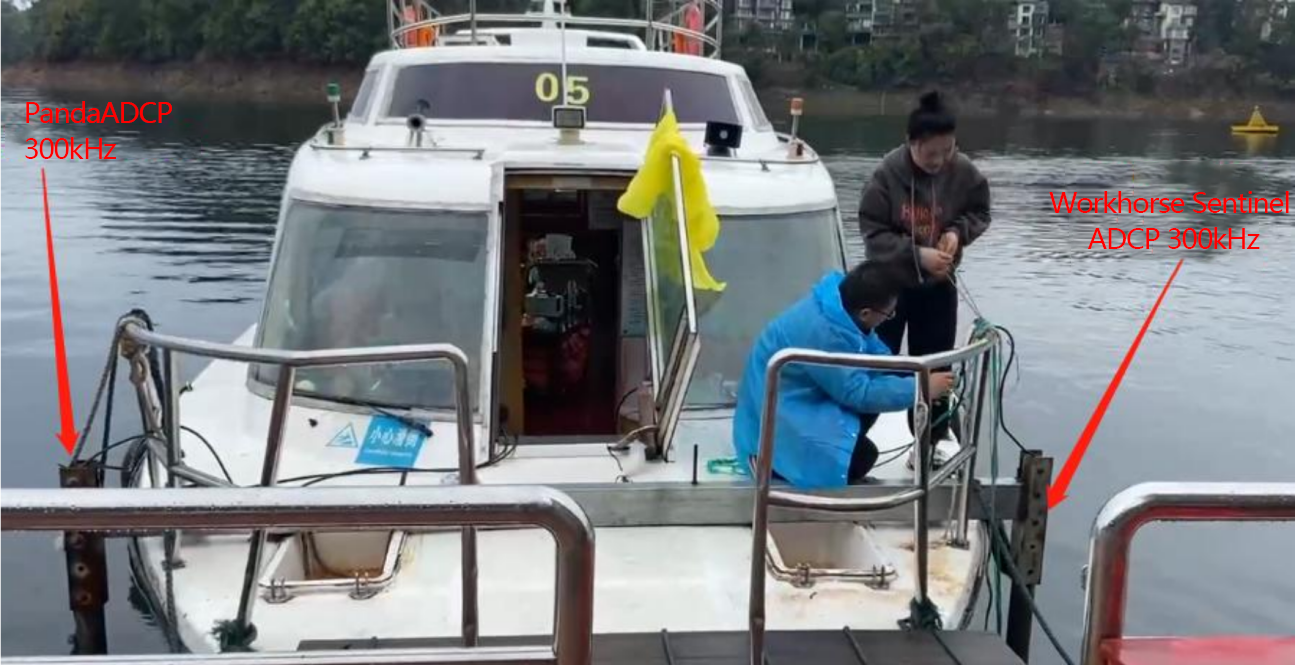
Figure 2.2.4 The ADCP has been installed.
After the ADCP is prepared, the GPS needs to be installed and debugged. The customized fixed frame has a special screw for the GPS. Screw the GPS into the screw, and lead the serial communication line into the cabin and connect it to the computer and configure the required output mode GPRMC of the GPS with an output frequency of 1Hz.
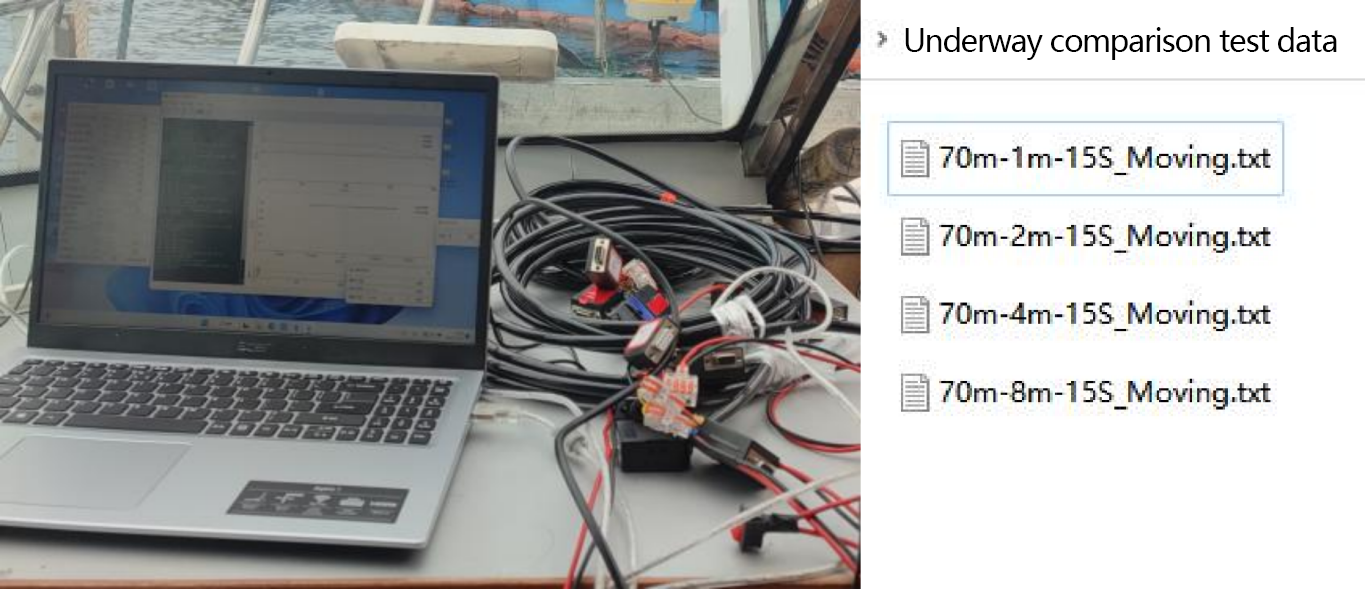
Figure 2.2.5 Software preparation
All preparations for PandaADCP-DR-300K, Workhorse Sentinel ADCP 300K and GPS have been completed. At 11:00, it is ready to enter the underway mode for testing.
A total of eight groups were measured in this underway comparison test. There were four groups for PandaADCP 300K and four groups for teledyne Workhorse Sentinel ADCP 300K. In the first two groups of the two ADCP, they sailed from the wharf of Southeast Lake to the 70-meter-deep area of Southeast Lake (from south to north) for round-trip underway. In the last two groups, they sailed from about 500 meters away from the wharf to the area near the water intake of Nongfu Spring in Qiandao Lake for round-trip underway.
The underway comparison test also uses an alternating transmission working method to ensure non-interference.
Workhorse Sentinel ADCP 300K leads the work. From 11:10 to 11:40, it sails from the wharf to the 70-meter-deep area with a resolution of 1m. From 11:42 to 12:12, it returns with a resolution set to 2m. PandaADCP-DR-300K sails from the wharf to the 70-meter-deep area from 12:20 to 12:50 with a resolution of also 1m. When returning, it is from 12:52 to 13:22. At this time, the resolution is 2m. From 13:40 to 14:10, the resolution of rdi adcp WHS300 is 4m, and the return resolution is set to 8m. From 14:48 to 15:18, PandaADCP-DR-300K starts to work. The resolution is set to 4m. It sails from about 500 meters away from the wharf to the area near the water intake of Nongfu Spring in Qiandao Lake. When returning, the resolution is set to 8m. See the following table for specific parameter settings:
Table 2. Parameter configuration table for underway test
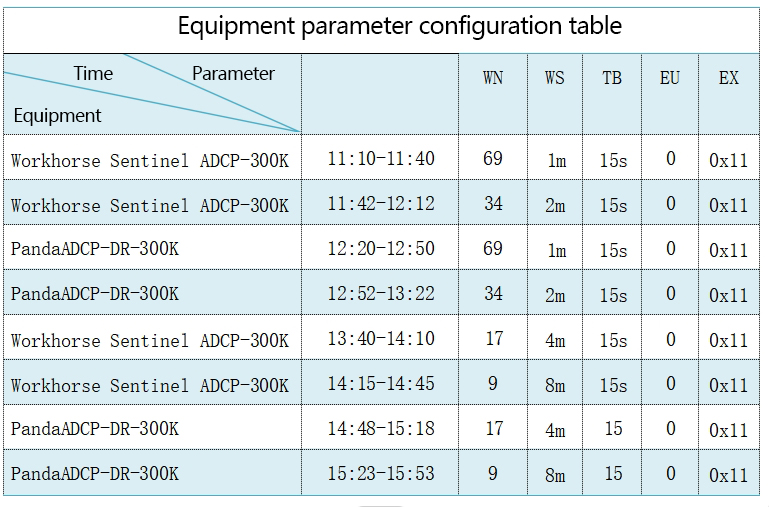
EU: Set the orientation of the ADCP (1 - upward, 0 - downward);
TB: Set the interval between pings, that is, the working cycle;
WN: Set the number of layers;
WS: Set the layer thickness;
EX: Set the coordinate system;
The completion time of the underway test is 16:30 (arriving at the wharf) and start to disassemble the ADCP.
2.2 Test Results
The test results with resolutions of 1m and 2m are compared in detail below. Similarly, Matlab is used to unpack and compare the PD0 results stored by the two ADCP.
(1) Comparison of flow measurement results with 1m layer thickness
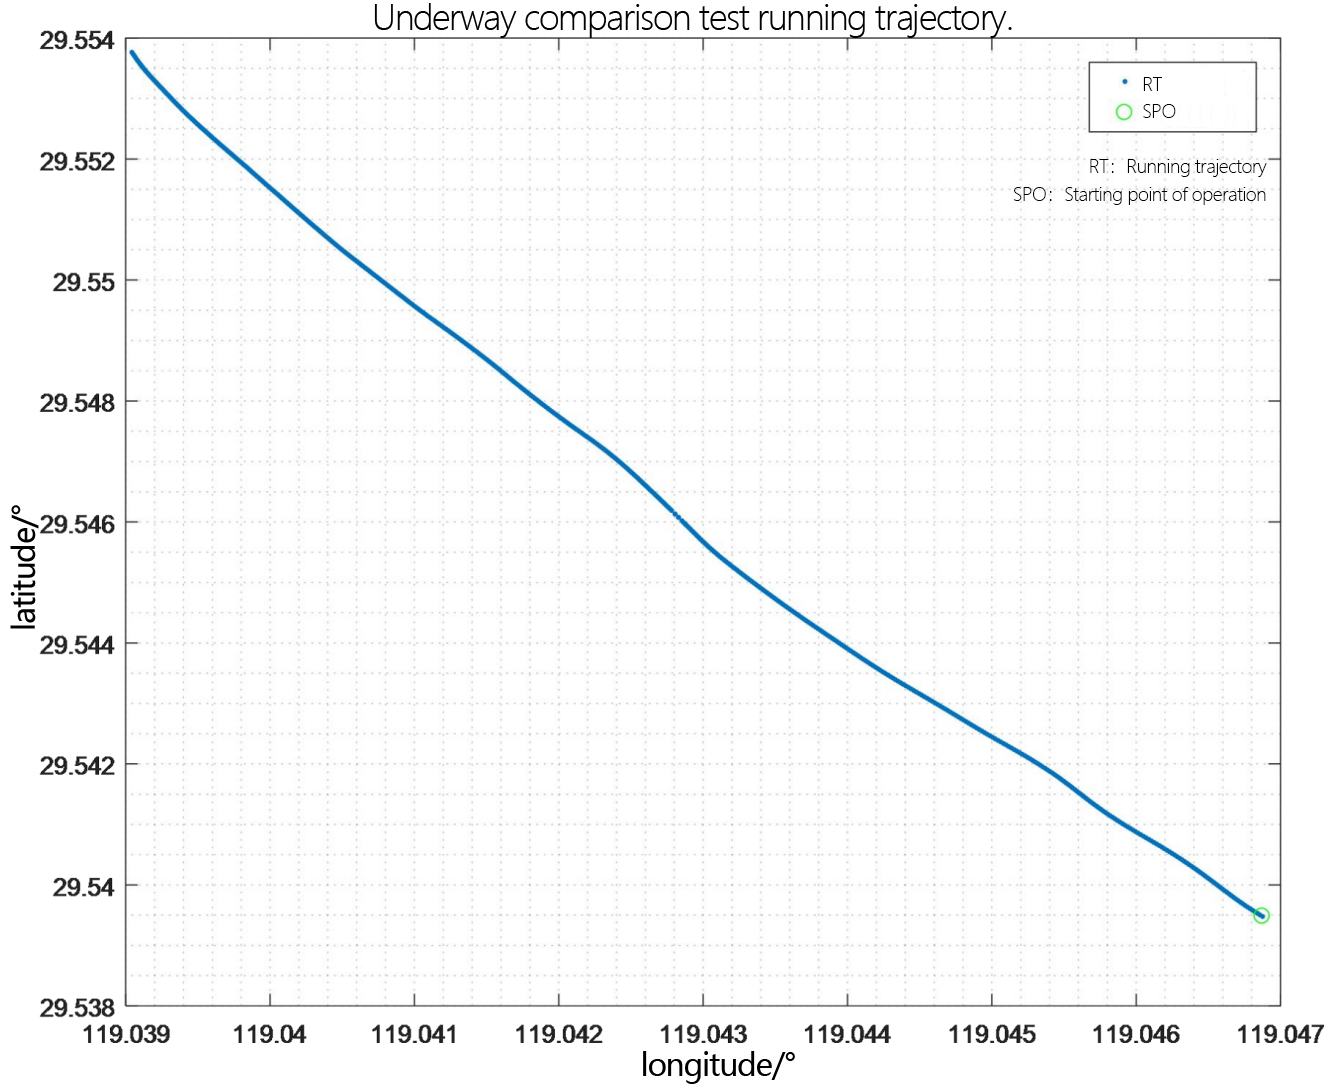
Figure 2.2.1 Underway flow measurement trajectory diagram - layer thickness 2m
Judging from the trajectory recorded by GPS, the overall running trajectory of the comparison process with a resolution of 1m moves from southeast to northwest.
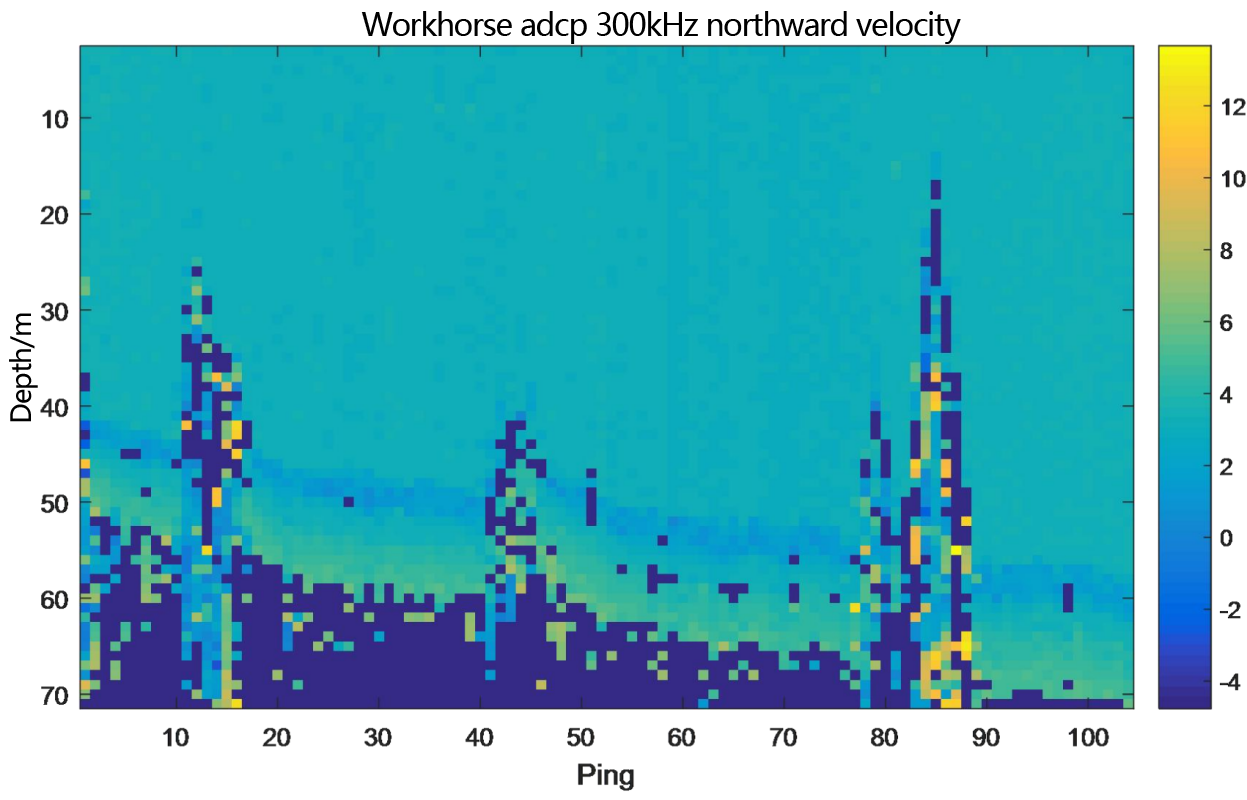
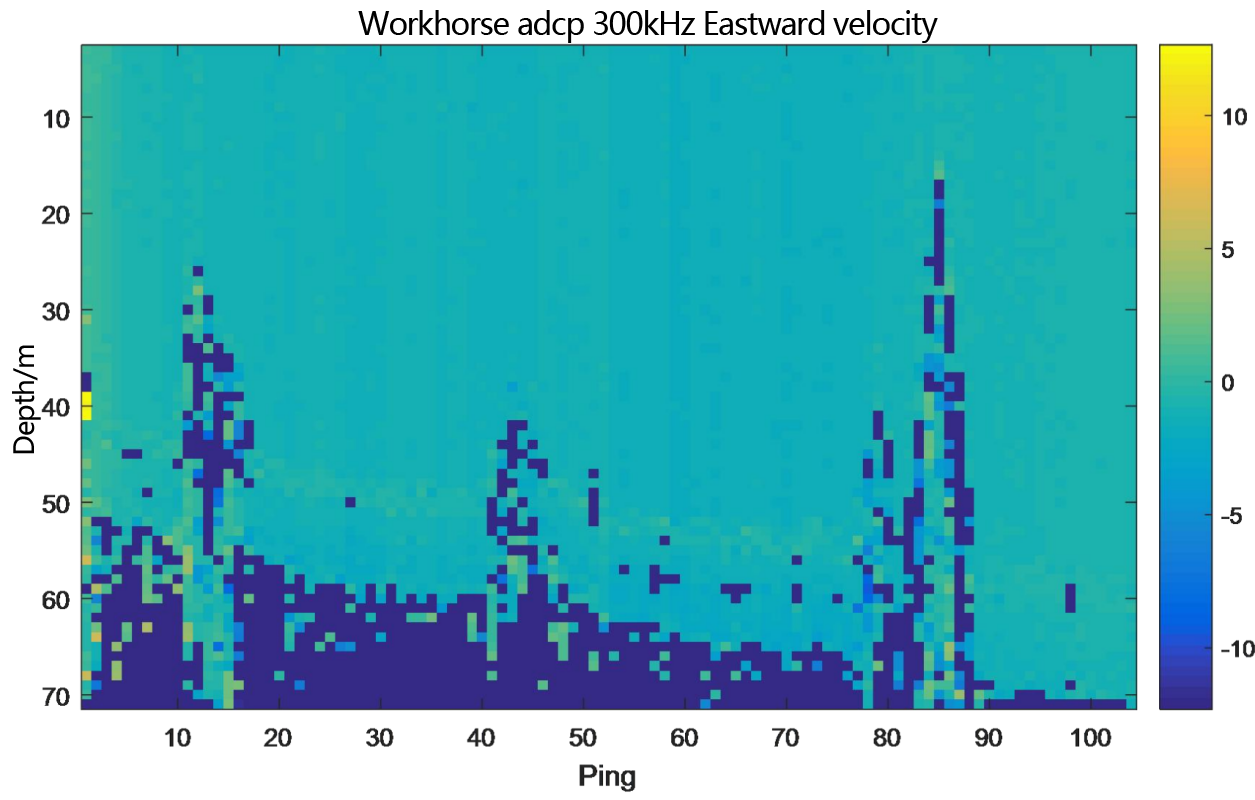
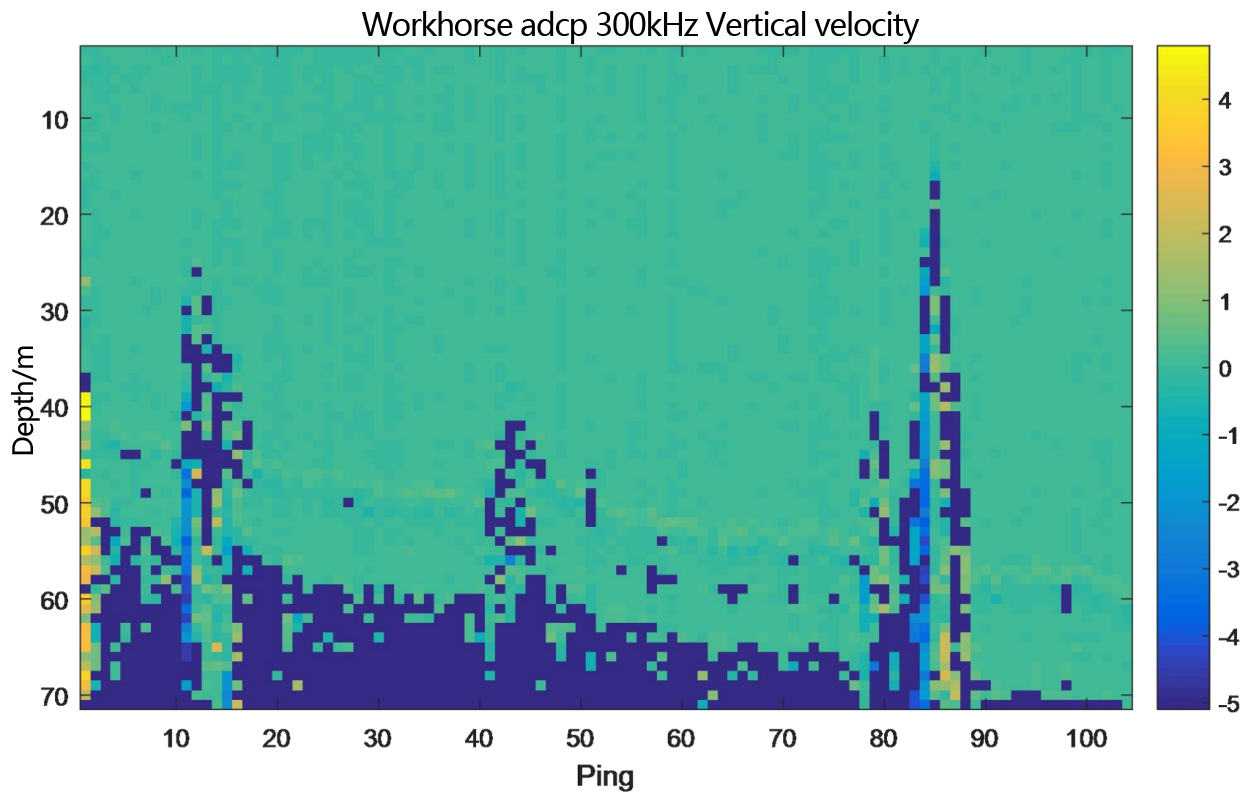
Figure 2.2.2 Underway flow measurement result diagram of teledyne workhorse adcp 300kHz - layer thickness 1m
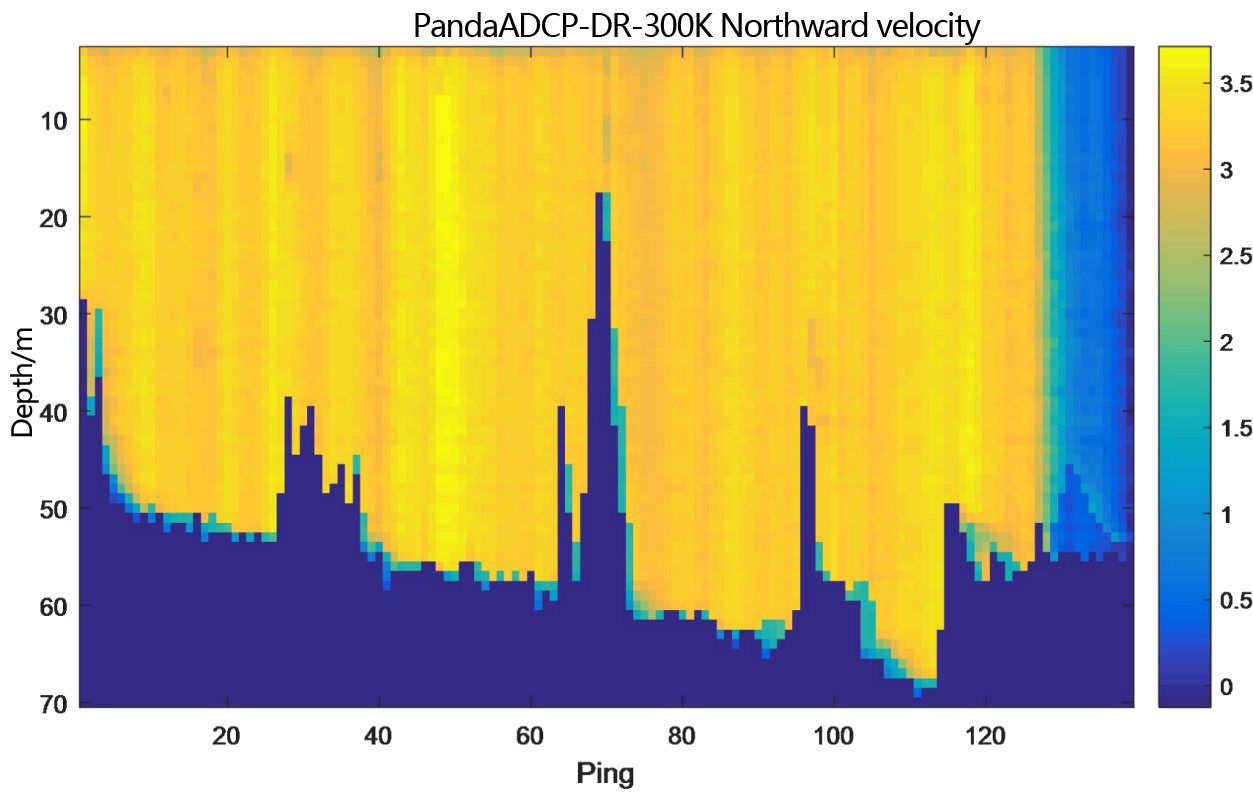
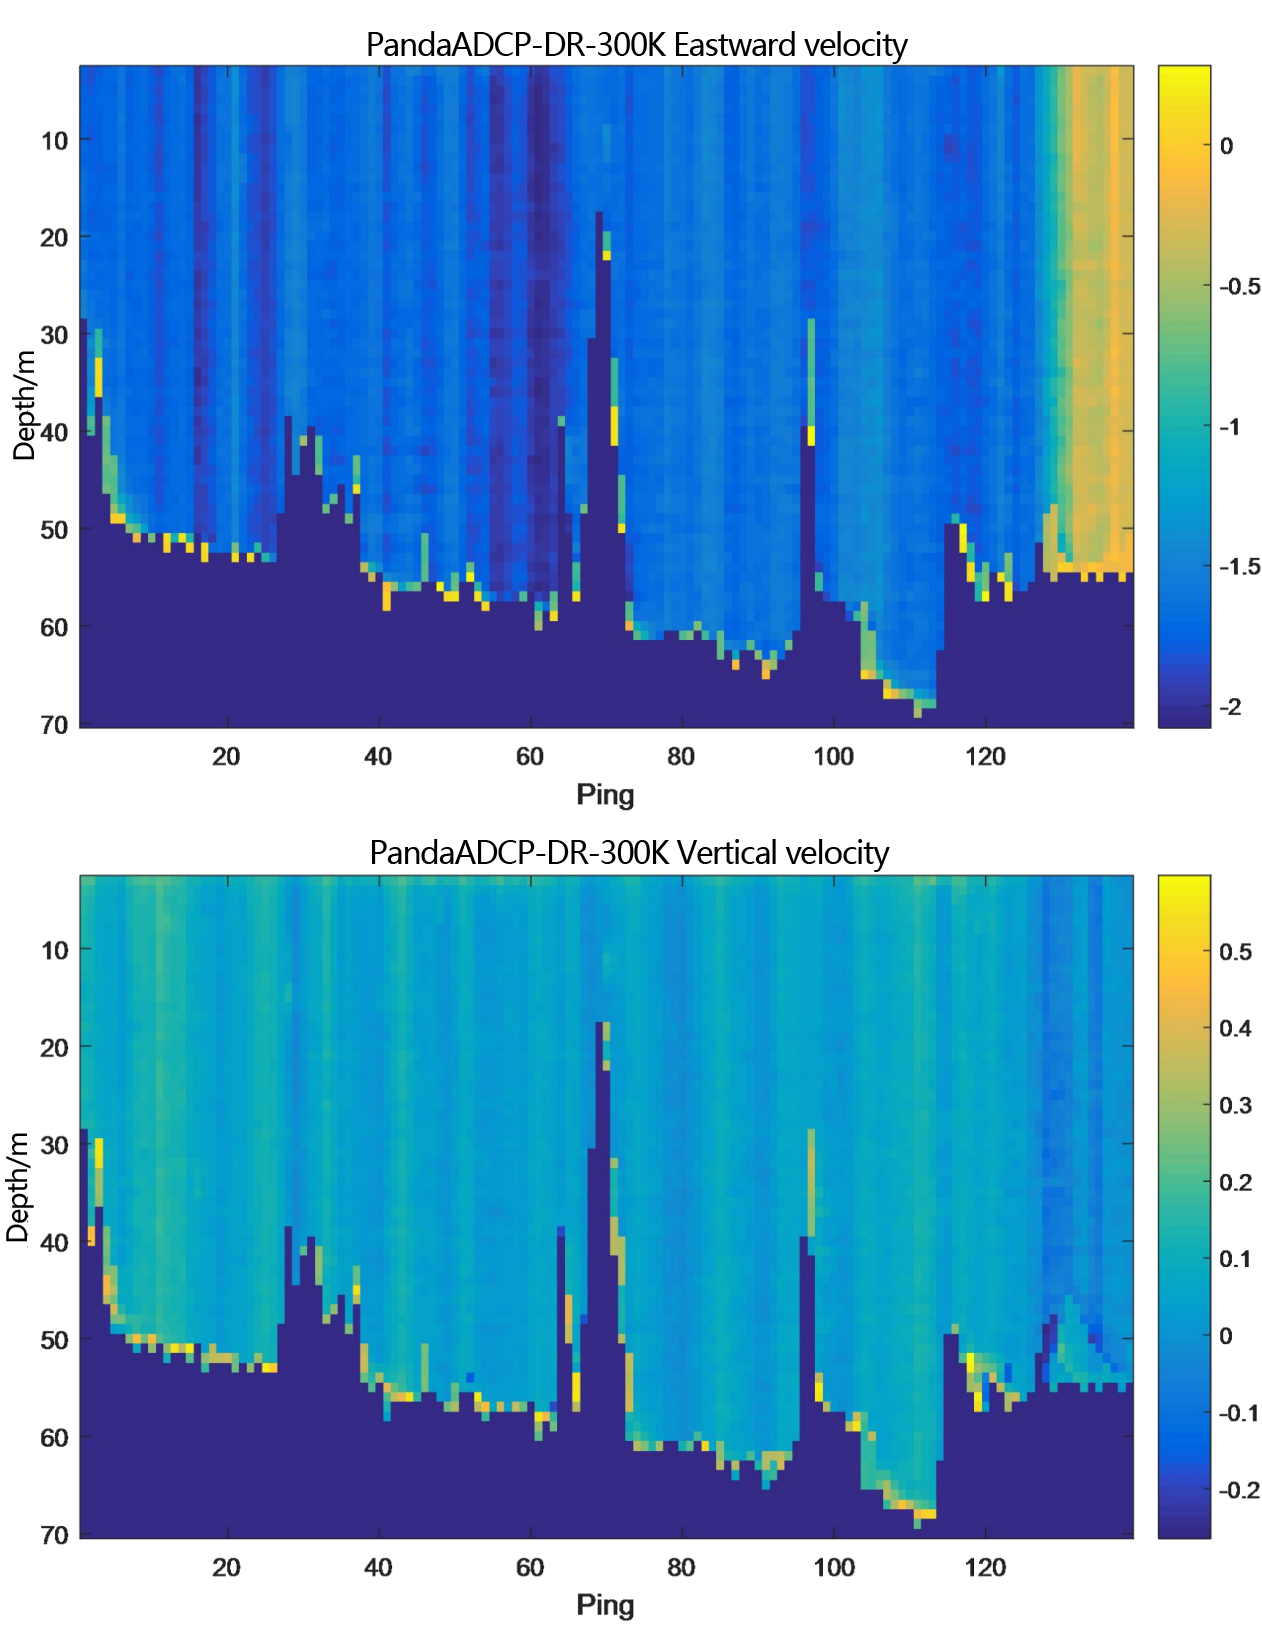
Figure 2.2.3 Underway flow measurement result diagram of PandaADCP 300kHz - layer thickness 1m
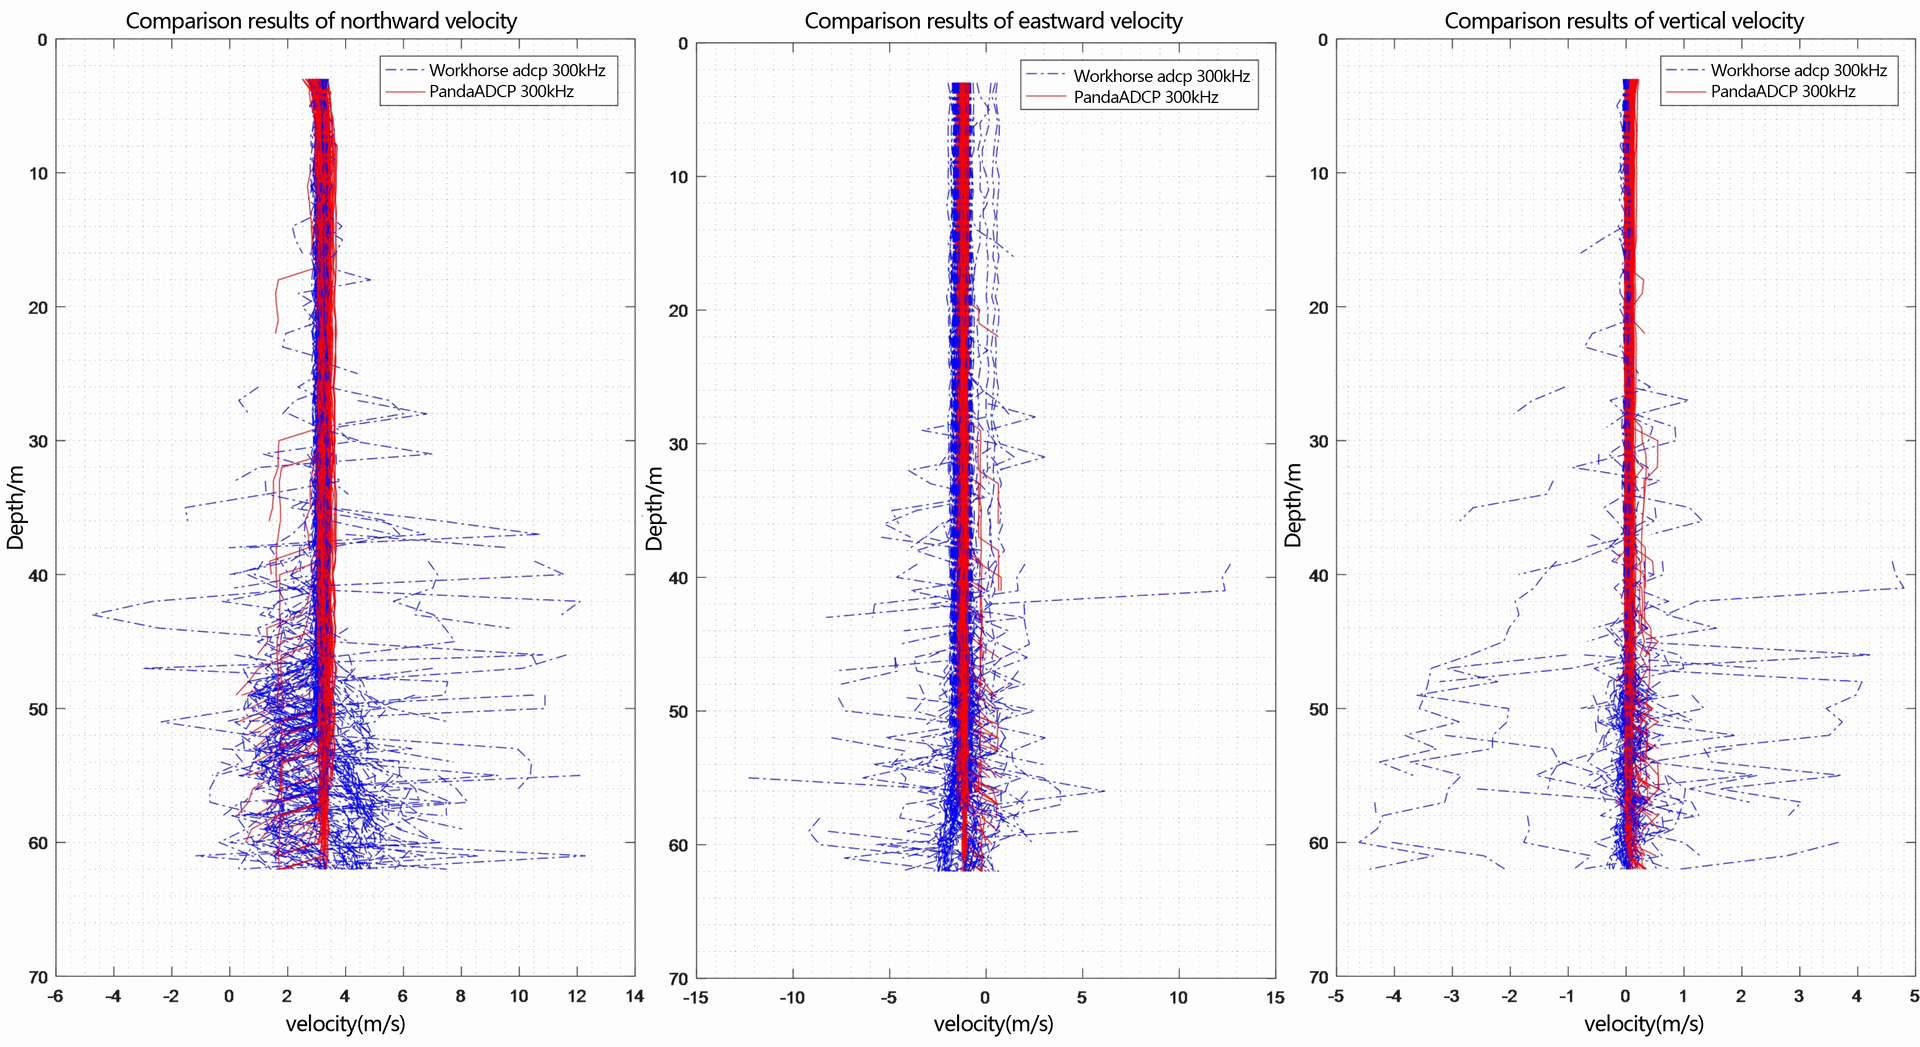
Figure 2.2.4 Multi-ping flow measurement result diagram of three-dimensional velocity - layer thickness 1m
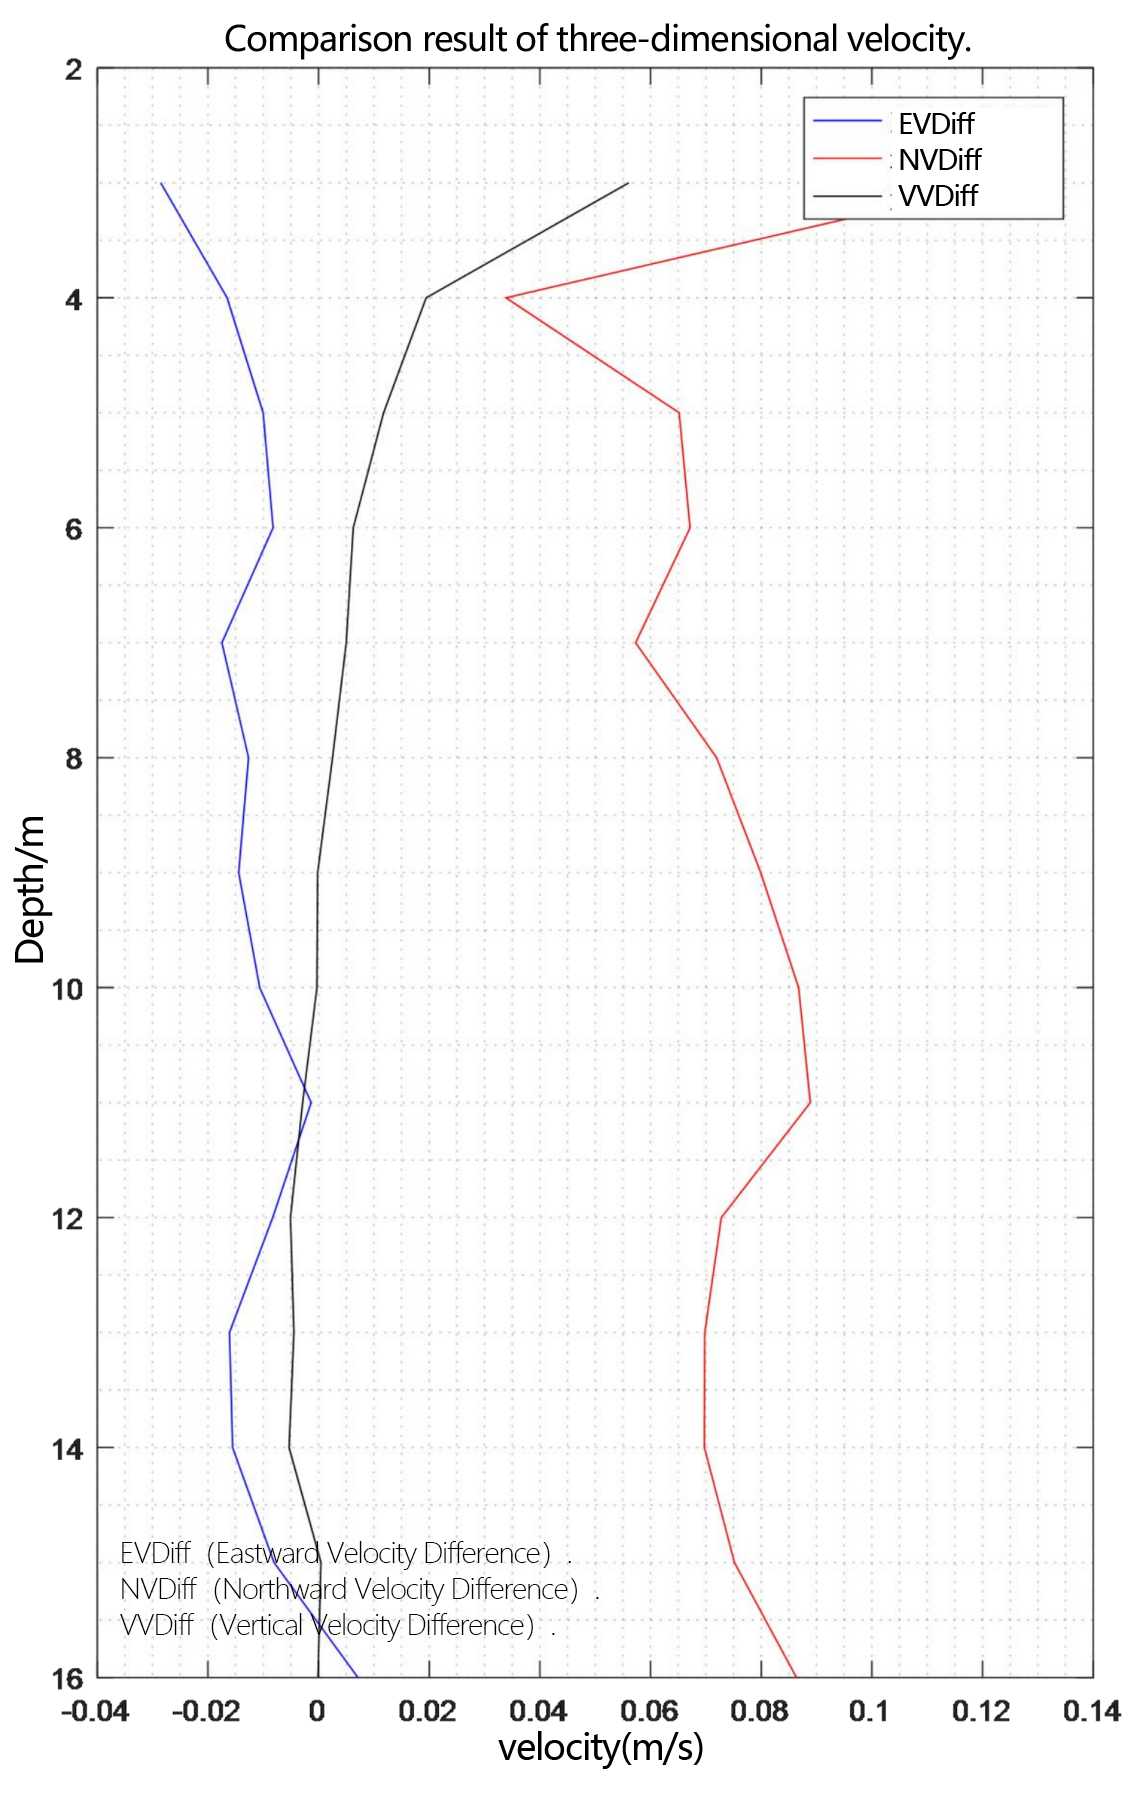
Figure 2.2.5 Comparison diagram of relative deviation of three-dimensional velocity
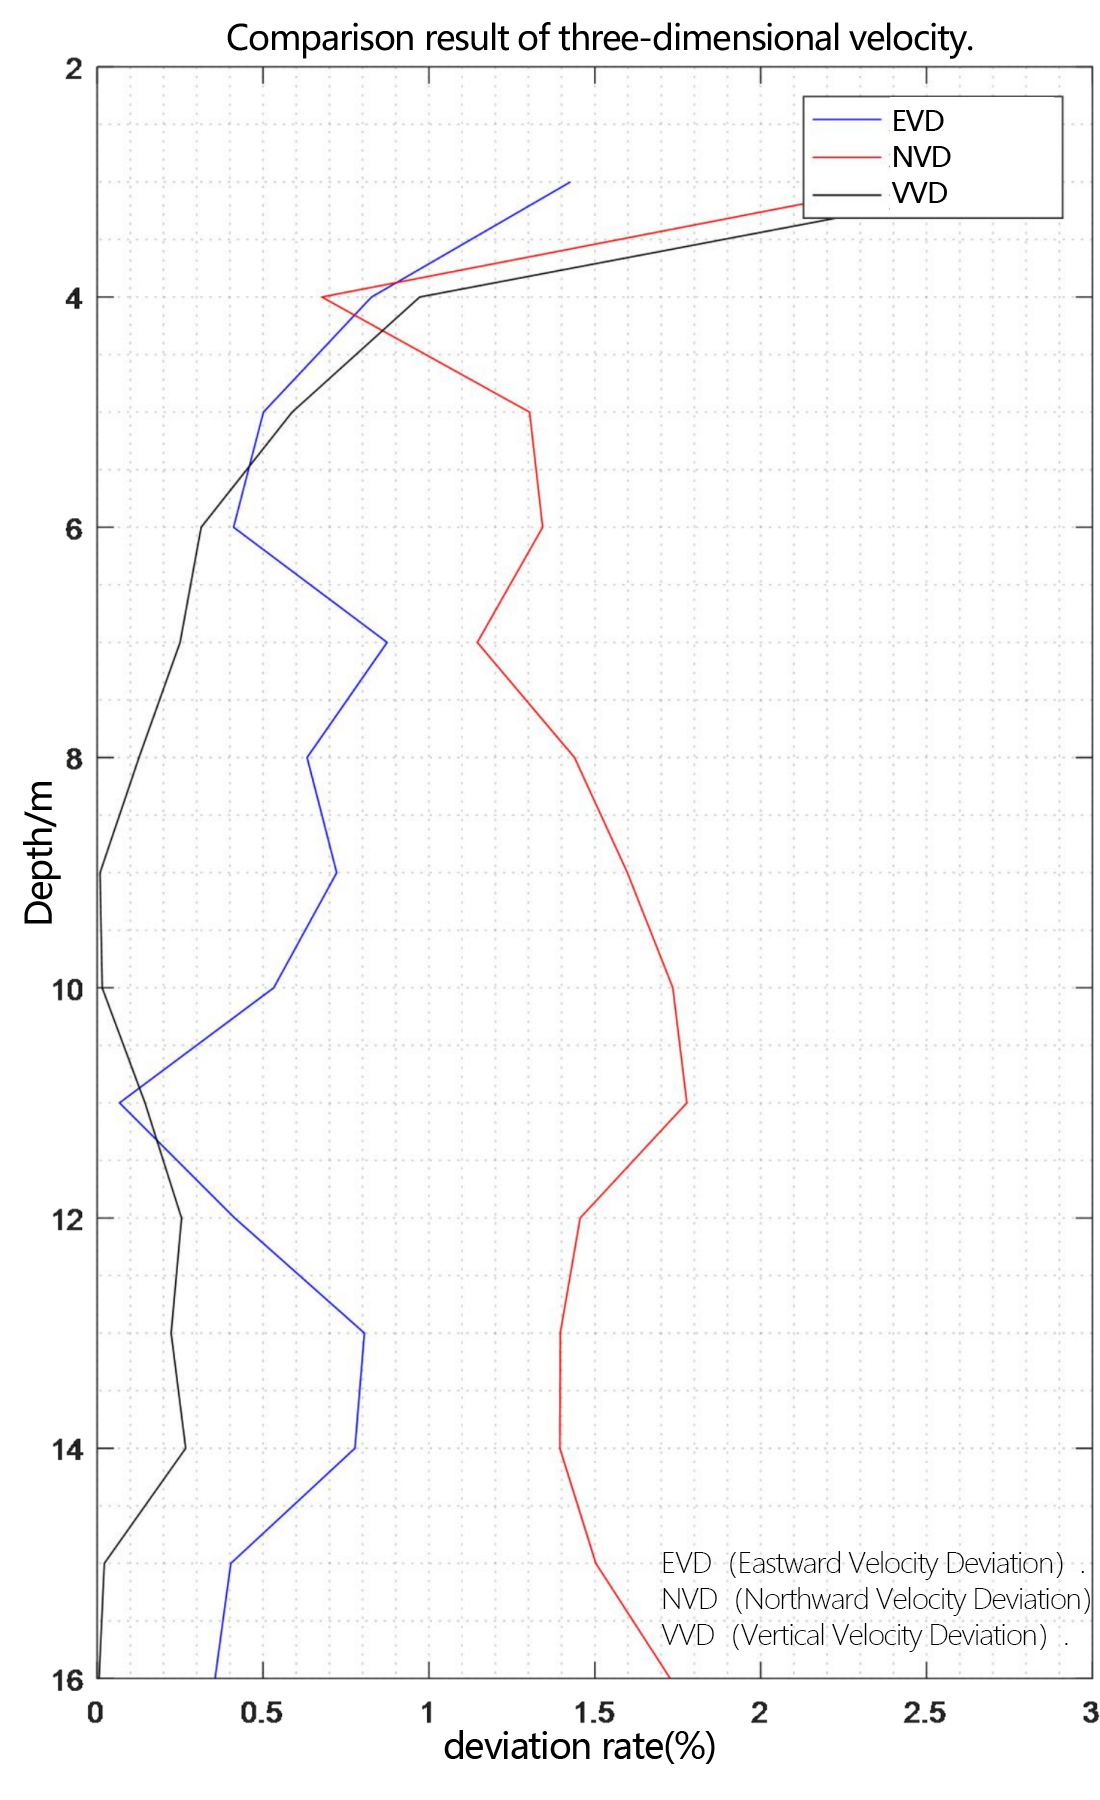
Figure 2.2.6 Comparison diagram of three-dimensional velocity deviation rate
From the flow measurement comparison results, it can be seen that the dynamic flow measurement ranges of the two ADCP are basically the same. The eastward velocity is -2.5m/s to 0.5m/s, the northward velocity is 2.5m/s to 4.0m/s, and the vertical velocity is -0.05m/s to 0.1m/s. Moreover, the flow measurement results of PandaADCP-DR-300kHz are more stable than those of rd instruments adcp workhorse sentinel 300kHz.
In the underway measurement mode, with a layer thickness of 1m, the relative deviation of the water flow velocity values measured by the two ADCP in the geodetic coordinate system is less than 2%.
(2) Comparison of flow measurement results with 2m layer thickness
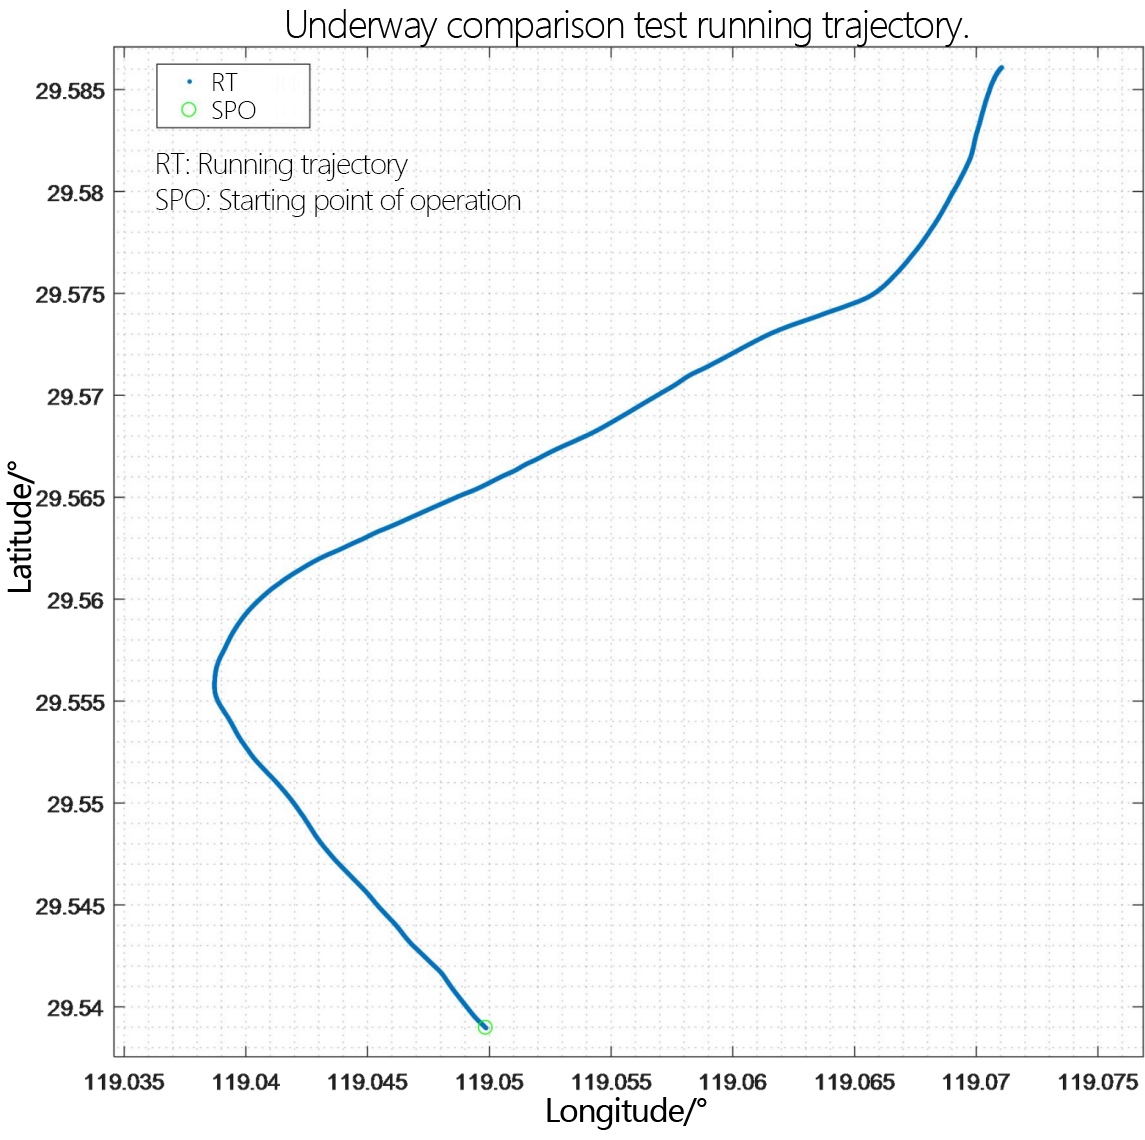
Figure 2.2.7 Underway flow measurement trajectory diagram - layer thickness 2m
Judging from the trajectory recorded by GPS, the overall running trajectory of the comparison process with a resolution of 2m moves from south to north.
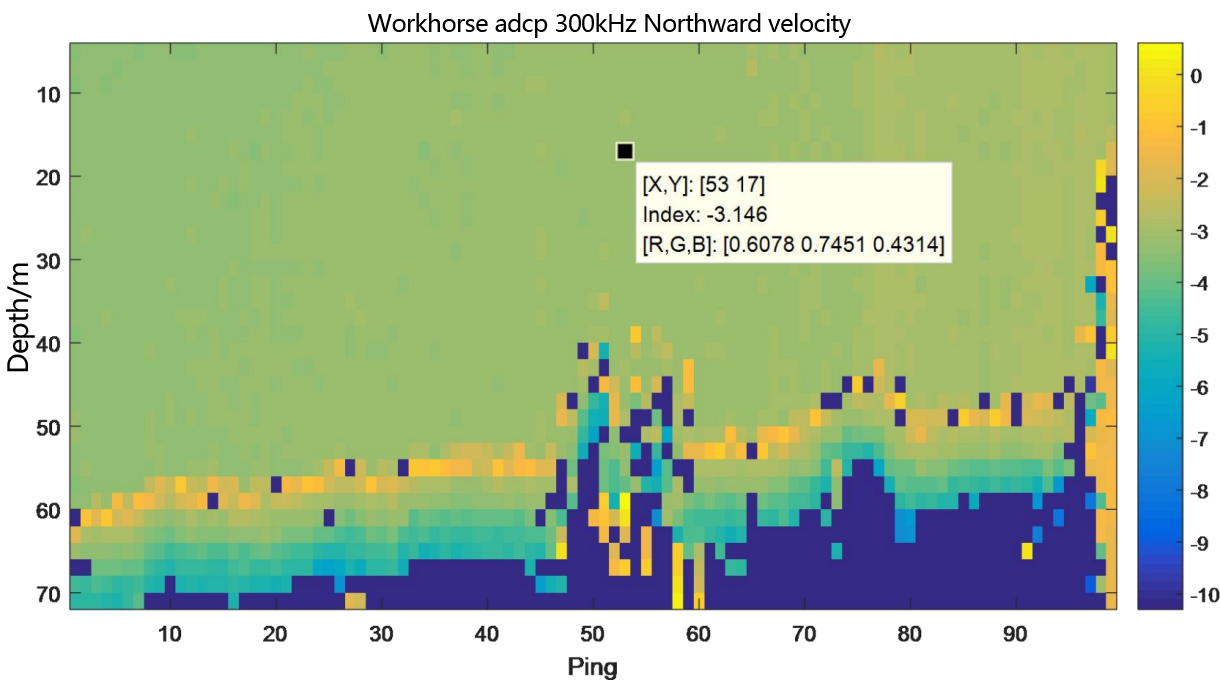
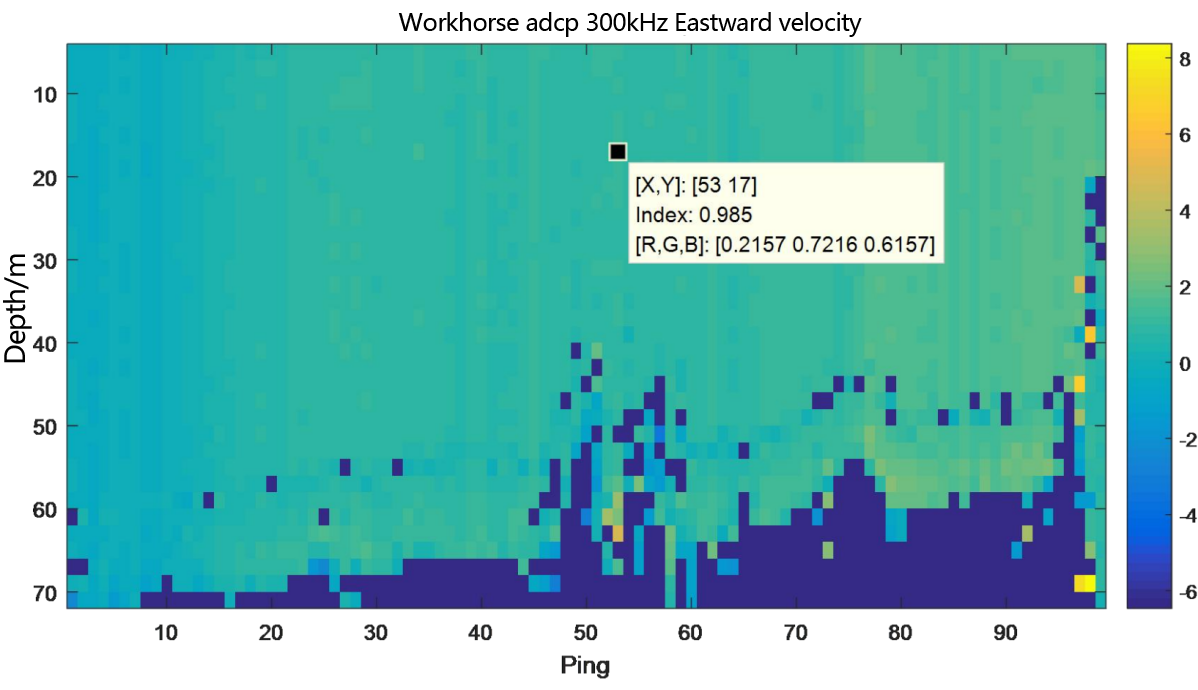
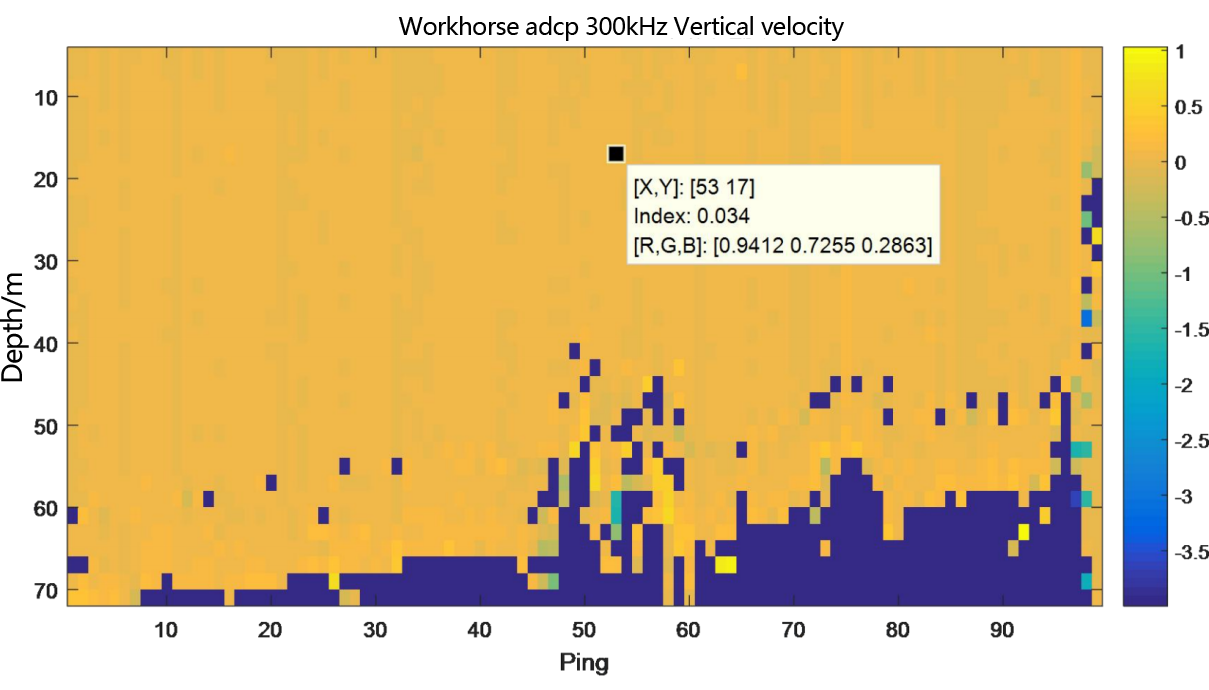
Figure 3.2.8.1 Underway flow measurement result diagram of teledyne workhorse adcp 300kHz- layer thickness 2m
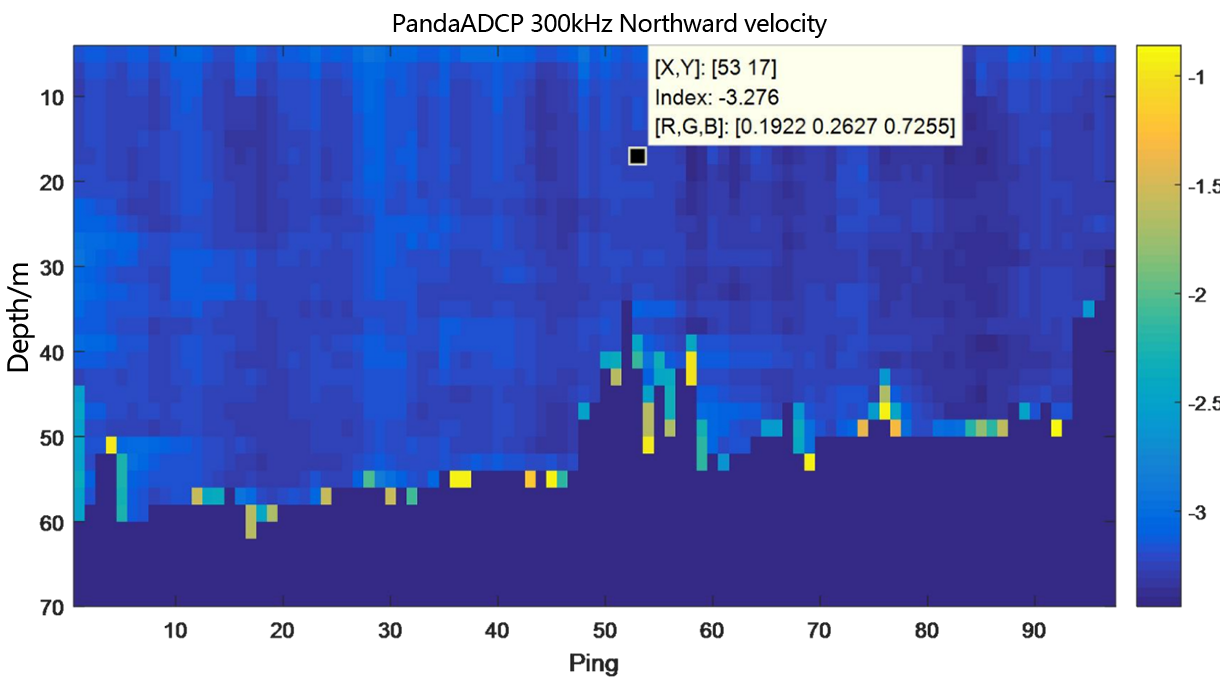
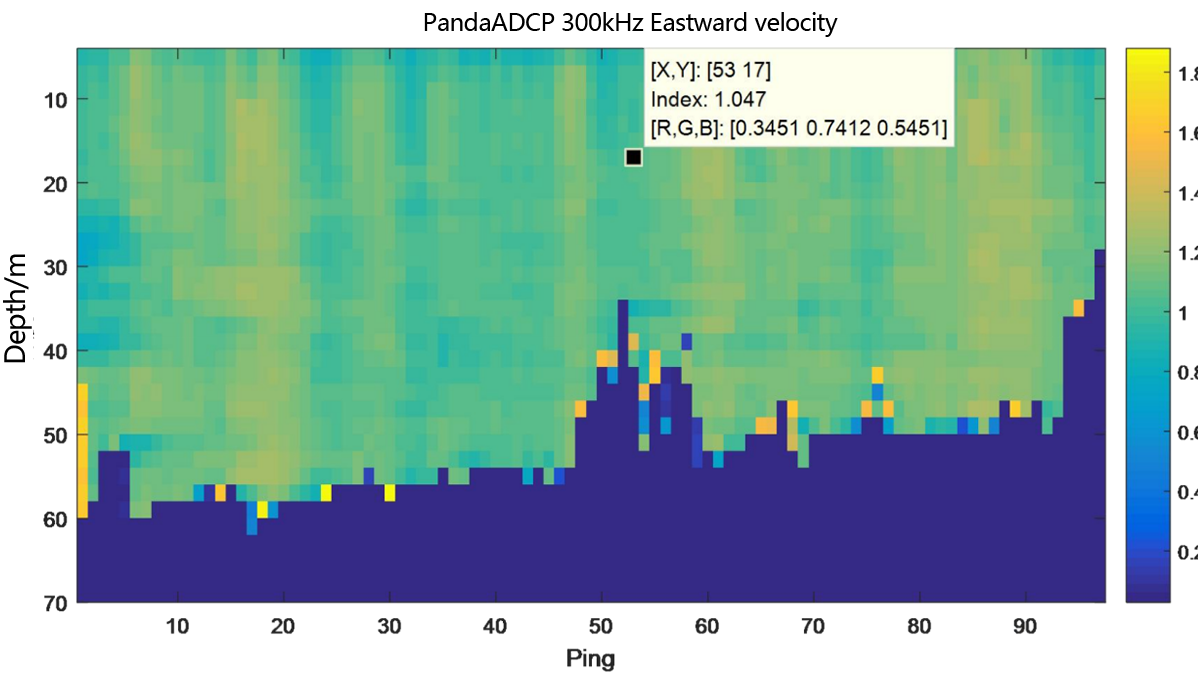
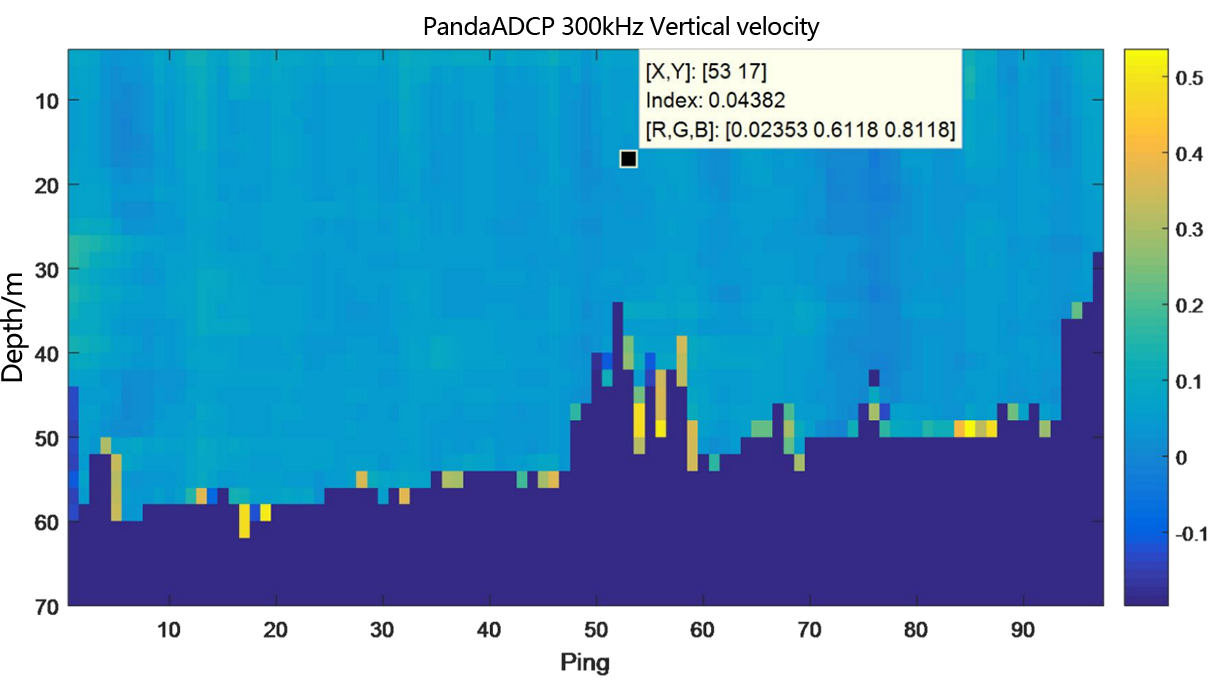
Figure 2.2.8.2 Underway flow measurement result diagram of PandaADCP-DR-300kHz - layer thickness 2m
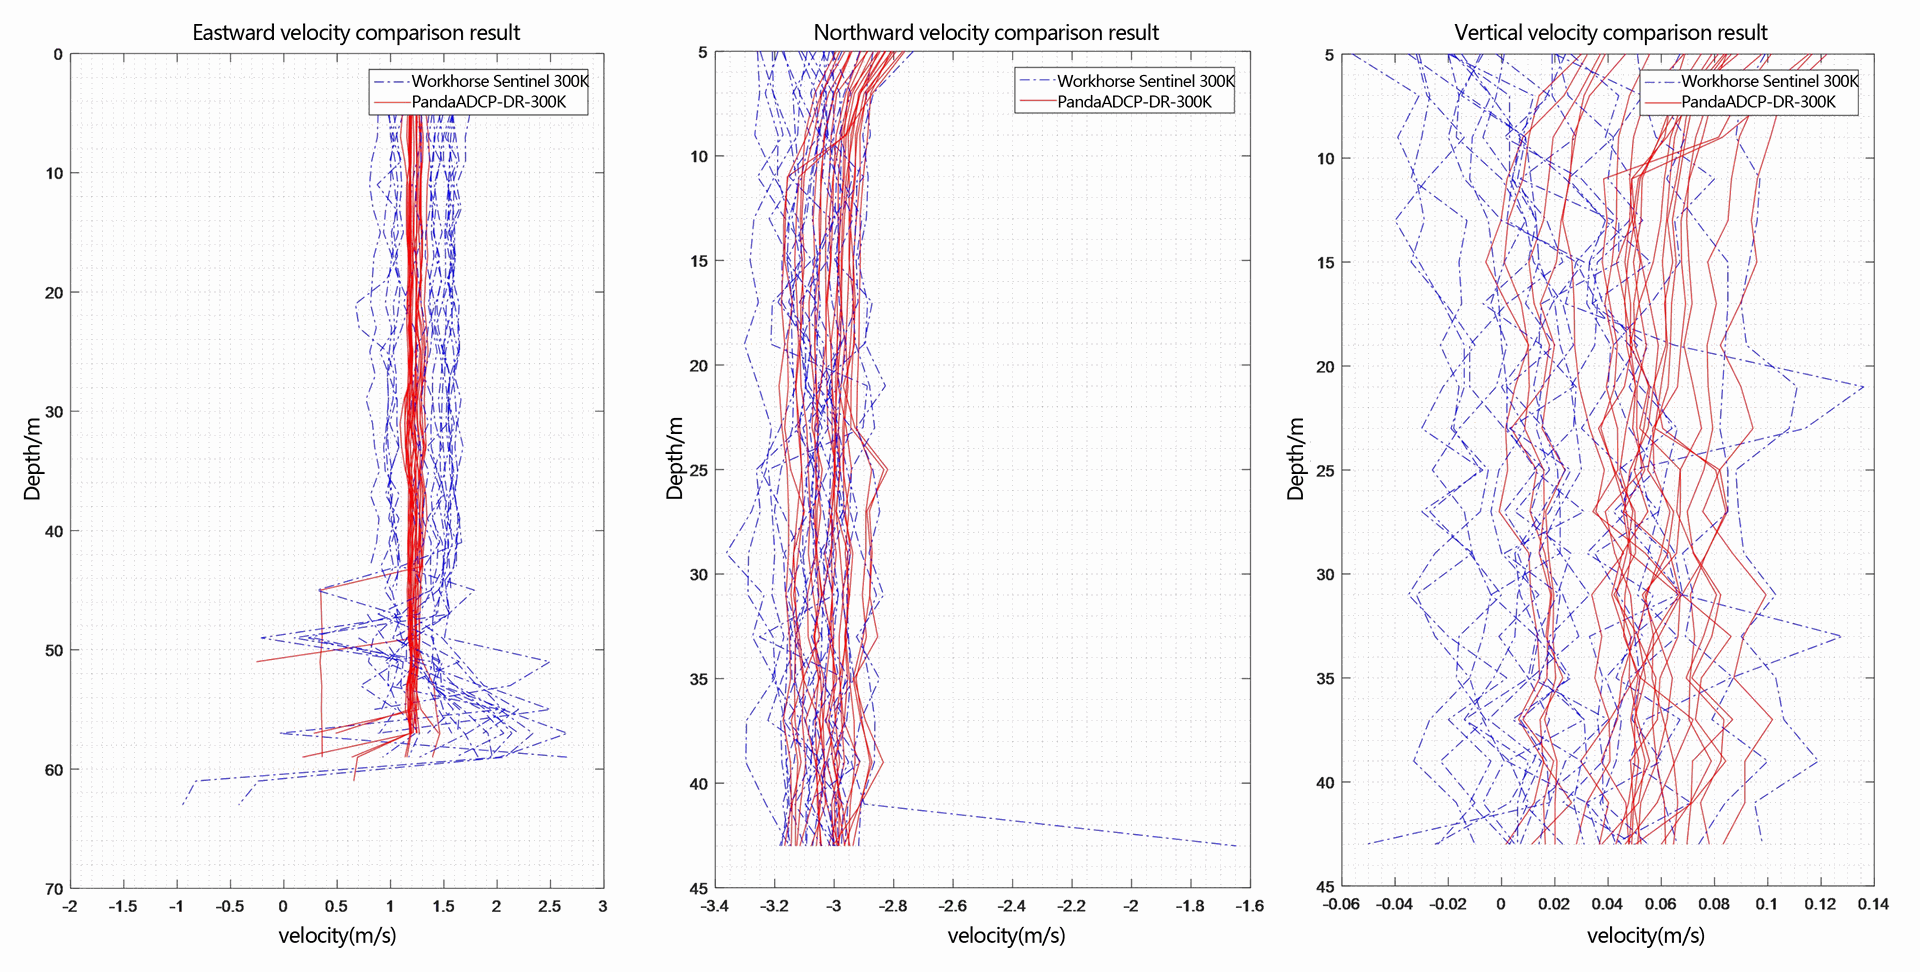
Figure 2.2.9 Multi-ping flow measurement result diagram of three-dimensional velocity - layer thickness 2m
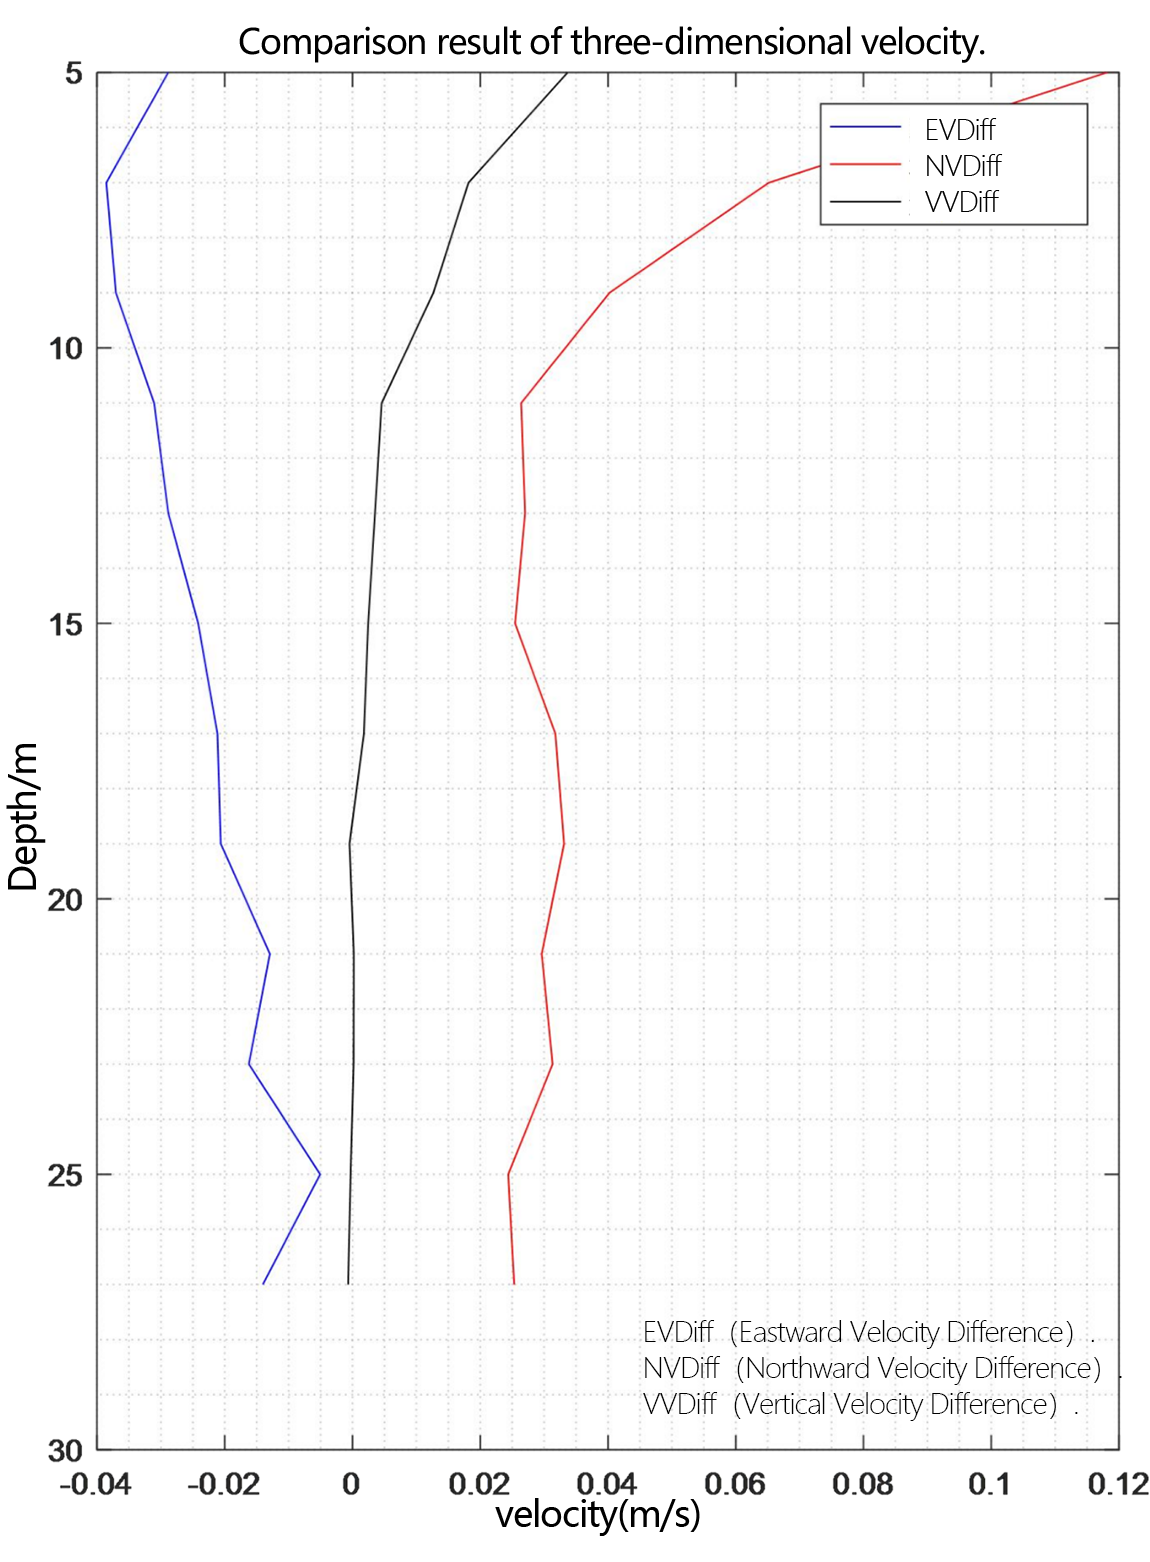
Figure 2.2.10 Comparison diagram of relative deviation of three-dimensional velocity
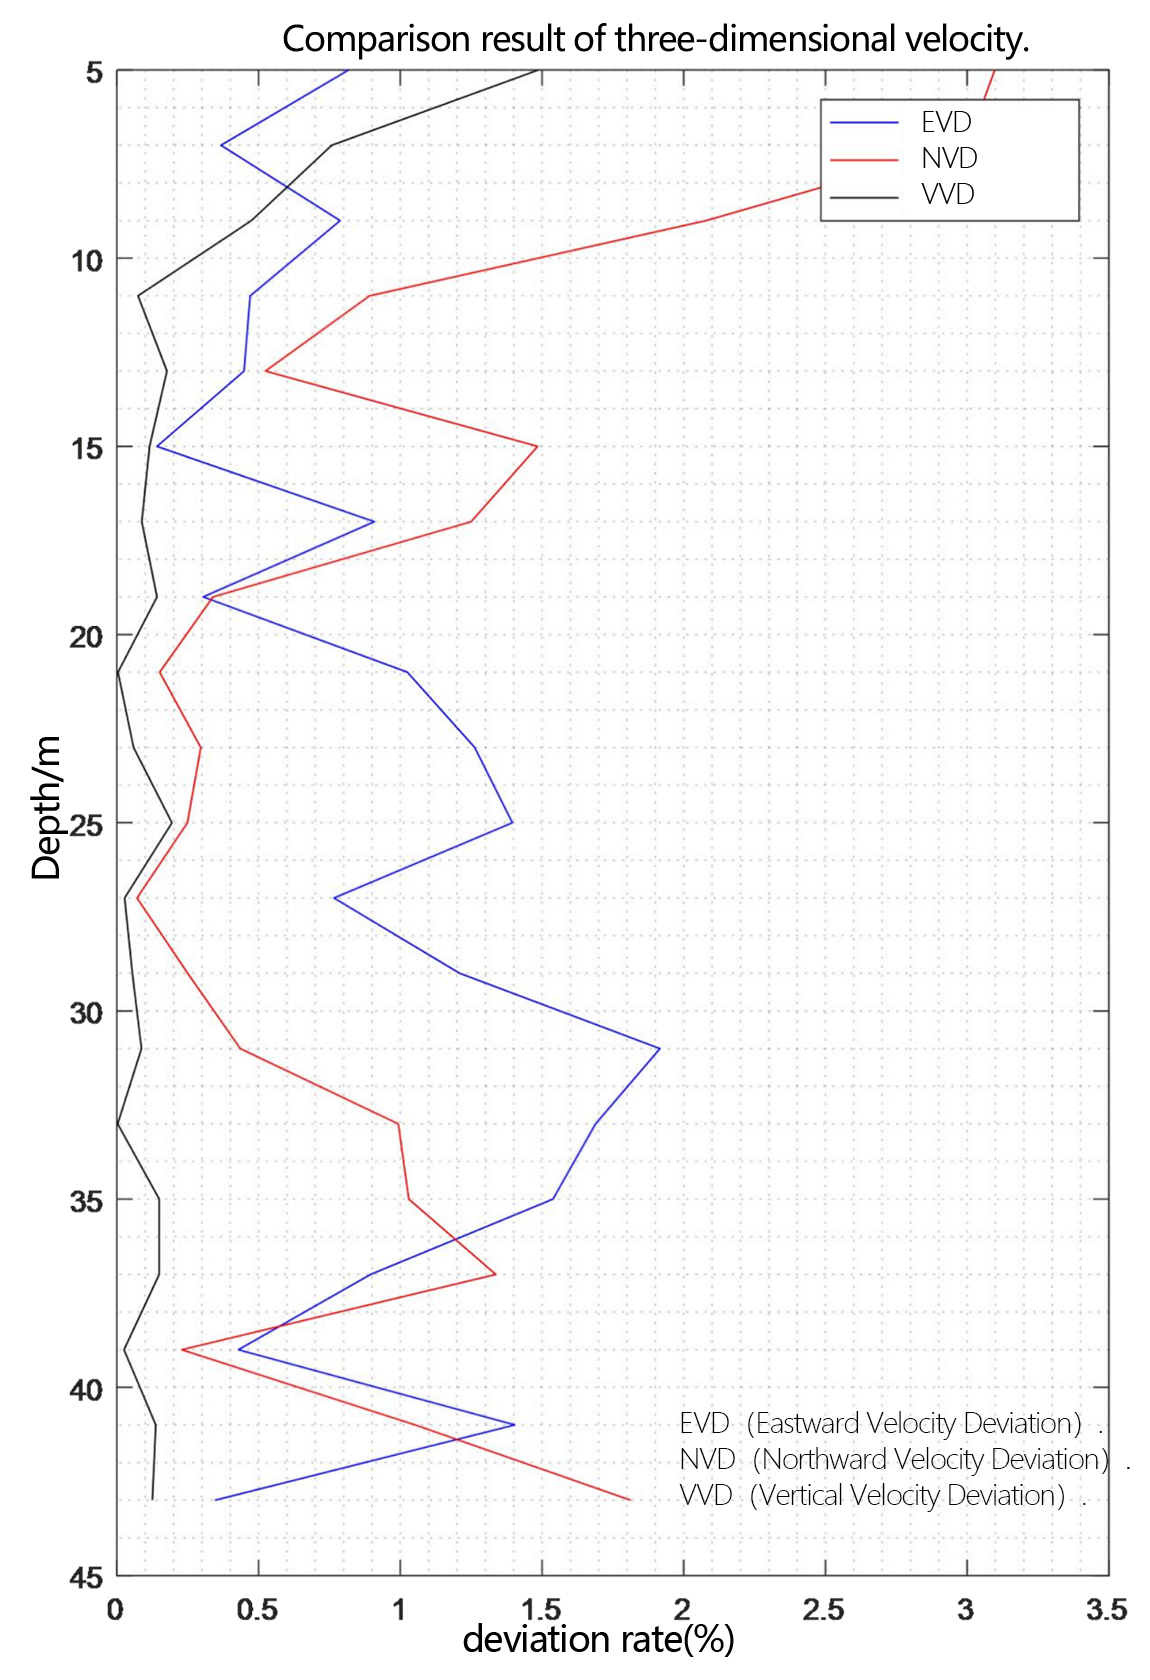
Figure 2.2.11 Comparison diagram of three-dimensional velocity deviation rate
From the flow measurement comparison results, it can be seen that the dynamic flow measurement ranges of the two ADCP are basically the same. The eastward velocity is 0.5m/s to 2.0m/s, the northward velocity is -3.4m/s to -2.8m/s, and the vertical velocity is -0.06m/s to 0.1m/s.
In the underway measurement mode, with a layer thickness of 2m, the relative deviation of the water flow velocity values measured by the two ADCP in the geodetic coordinate system is less than 2%.
3. Test Conclusion
In this comparative test, two types of ADCP, China Sonar PandaADCP-DR-300K and TRDI Workhorse Sentinel ADCP 300K, are used to comprehensively compare the flow measurement performance in the underway mode. In order to accurately compare the measurement performance of the two, Matlab is used to analyze and compare the PD0 result data stored by the two types of ADCP. The comparison results show that in the underway mode, the relative deviation of the water flow velocity values measured by the two is less than 2%.
PandaADCP 300K VS Teledyne RDI Workhorse Sentinel ADCP 300K